Figure 1.

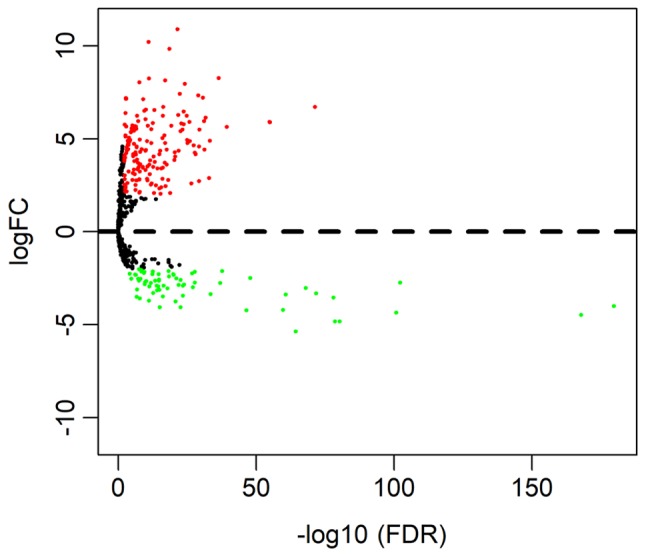
Volcano plot of differentially expressed miRNAs. The red dots represent upregulated miRNA, and green dots represent downregulated miRNA. miRNA, microRNA.

Volcano plot of differentially expressed miRNAs. The red dots represent upregulated miRNA, and green dots represent downregulated miRNA. miRNA, microRNA.