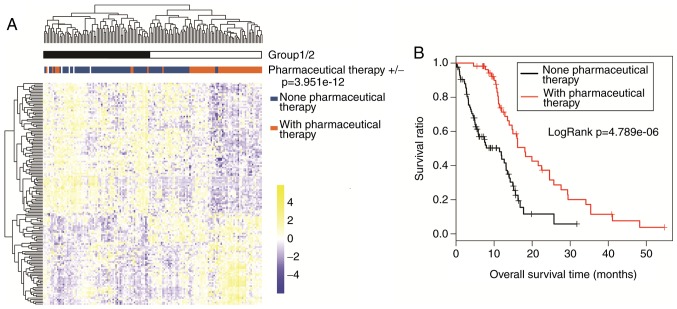
Figure 2.
Association of pharmaceutical therapy with prognosis. (A) Two-way hierarchical clustering analysis of the 148 prognosis-related genes. TCGA samples were categorized into group 1 and group 2, based in the hierarchical clustering. The two groups were compared for pharmaceutical therapy using chi-square test (P=3.951×10⁻¹²). (B) Kaplan-Meier survival analysis of patients with or without pharmaceutical therapy in TCGA set. TCGA, The Cancer Genome Atlas.

