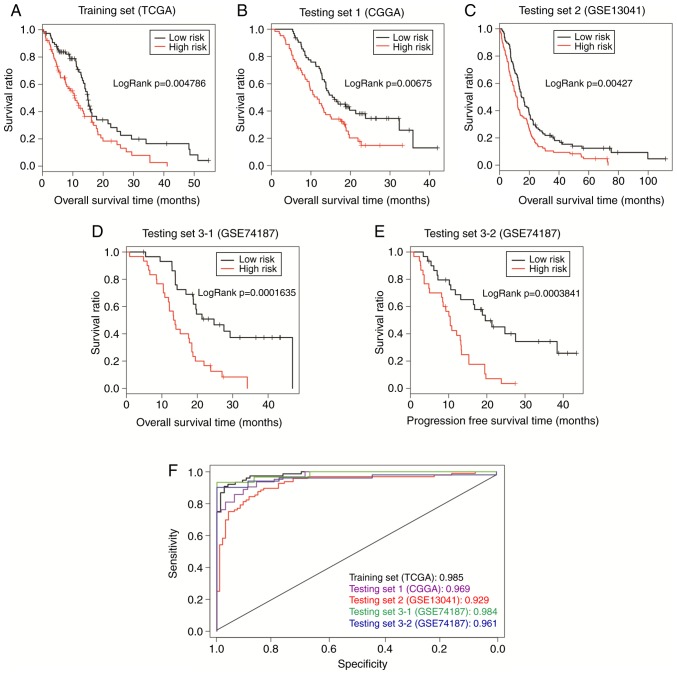
Figure 4.
Prognosis performance of the pathway-based model. Samples in (A) TCGA set, (B) CGGA set, (C) GSE13041, and (D and E) GSE74187 were dichotomized by PI into a high-risk group and a low-risk group. The two groups were compared by Kaplan-Meier curves, and the P-value was calculated by log-rank test. (F) Comparison of ROC curves between different sets. ROC curves were generated with PI values as predictions compared to overall survival or progression-free survival. TCGA, The Cancer Genome Atlas; CGGA, Chinese Glioma Genome Atlas; PI, prognosis index; ROC, receiver operating characteristic.

