
Fig. 4. LPA disrupted barrier function of RBEC monolayer cultures through LPA6.
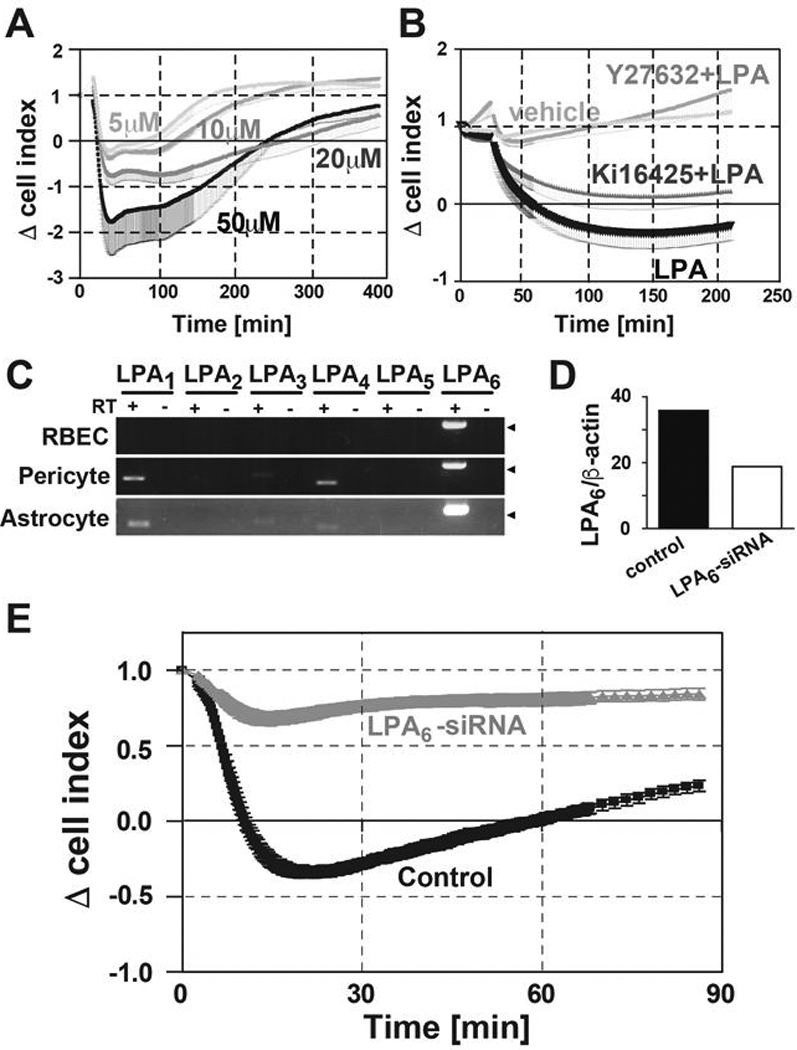
(A) Change of cell index in RBECs treated with 5, 10, 20 and 50 μM of LPA was evaluated by the xCELLigence system (n = 3). Data is representative of two independent experiments with similar results. Mean - SEM (B) RBECs were pretreated with or without 10 μM Y-27632 and 10 μM Ki16425 for 10 min. Then 10 μM LPA was added and the change of cell index was monitored (n = 3). Data are representative of two independent experiments with similar results. Mean - SEM. (C) mRNA expression profile of LPA receptors in RBECs pericytes and astrocytes were analyzed by RT-PCR. Arrowheads indicate the 200-bp DNA size marker. (D) Expression levels of LPA6 and β-actin mRNA are presented as a percentage of those with control siRNA (n = 2). Data is representative of three independent experiments with similar results. (E) Change of cell index in RBECs treated with 50 μM LPA was evaluated by xCELLigence system 48 h after siRNA transfection (n = 3). Data is representative of three independent experiments with similar results. Mean ± SEM.