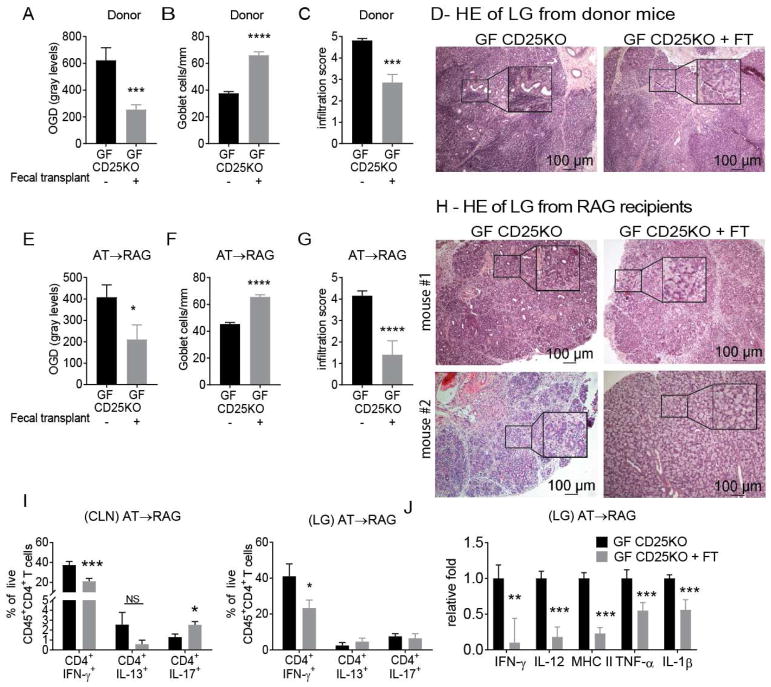
Figure 3. Fecal Microbiota Transplant in Germ-free CD25KO Ameliorates the Autoimmune Phenotype.
Germ-free (GF) CD25KO were removed from isolators at four weeks of age and received a fecal transplant (FT) of fecal microbiota and were kept in normal vivarium until they reached 8 weeks of age. CD4+ T cells were isolated from spleens and cervical lymph nodes (CLN) and adoptively transferred into RAG1KO recipients (AT→ RAG). Ocular and lacrimal gland phenotype was investigated in both donor mice and RAG1KO recipients. (A–D) Donor mice phenotype after fecal transplant. (A) Corneal permeability measured as an uptake of fluorescent Oregon-Green dextran (OGD) dye. Bar graphs show means ± SEM of three independent experiments (final n = eighteen to twenty-one animals). Parametric t- tests were used to make comparisons between groups. (B) Number of PAS+ conjunctival goblet cells counted in paraffin-embedded sections. Bar graphs show means ± SEM of two independent experiments, final n = five right eyes for each group. Parametric t- tests were used to make comparisons between groups. (C) Inflammation scores of lacrimal gland pathology of donor and AT recipients. Bar graphs show average of two independent experiments (final n = ten animals). Nonparametric Mann–Whitney U statistical tests were used to make comparisons of inflammation scores. (D) Representative pictures of haematoxylin and eosin (H&E)-stained sections of lacrimal gland in donor mice. (E–J) Dry eye phenotype in RAG1KO recipients. (E) Corneal permeability measured as an uptake of fluorescent Oregon-Green dextran (OGD) dye. Bar graphs are means ± SEM of two independent experiments (final n = eight to ten animals). Parametric t- tests were used to make comparisons between groups. (F) Number of PAS+ conjunctival goblet cells counted in paraffin-embedded sections expressed as number per millimeter. Bar graphs show means ± SEM of two independent experiments, final n = five right eyes for each group. Parametric t- tests were used to make comparisons between groups. (G) Inflammation scores of lacrimal gland pathology in AT recipients. Bar graphs show average of two independent experiments (final n = ten animals). Nonparametric Mann–Whitney U statistical tests were used to make comparisons of inflammation scores. (H) Representative pictures of haematoxylin and eosin (H&E)-stained sections of lacrimal gland in adoptive transfer RAG1KO recipients; showing two mice per group. Black quadrants insets are high magnification of smaller black demarcated area. (I) Flow cytometric analysis of cervical lymph nodes and lacrimal gland of adoptive transfer RAG1KO recipients. Bar graphs show means ± SEM of two independent experiments (final n = seven to eleven animals/group). Parametric t-tests were used to make comparisons between groups.(J) Gene expression analysis in lacrimal gland lysates of adoptive transfer recipients. Bar graphs show means ± SD of two independent experiments, final n = nine to ten mice/group. Parametric t- tests were used to make comparisons between groups.
*P < 0.05; **P<0.01; ***P<0.001; ****P<0.0001
LG = lacrimal gland; CLN = cervical lymph nodes; NS = non-significant

