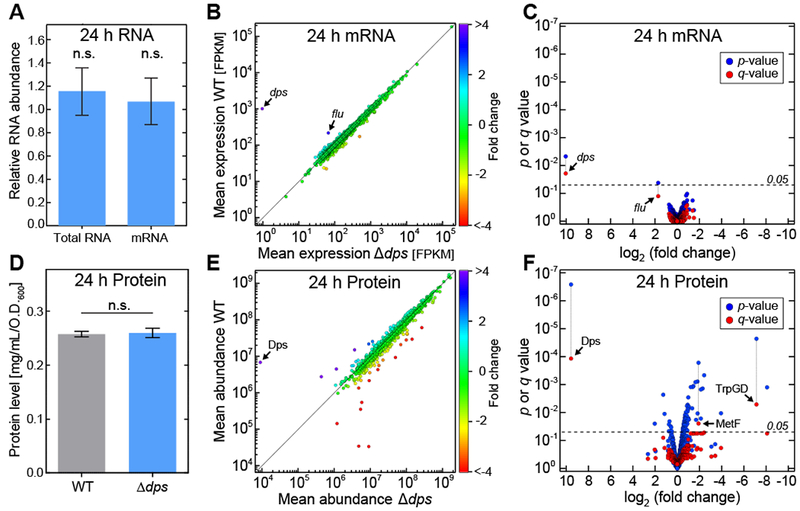
Figure 2. Dps has no influence on the transcriptome and mild influence on the proteome in stationary-phase E. coli cells.

(A) The relative amounts of total RNA and mRNA (mean ± SE).. (B) Differential expression analysis of RNA sequencing. For each gene, the mean expression in the wild-type strain is plotted against the corresponding value in the Δdps strain. Colors represent the fold-difference between the two strains. (C) The significance of the shift in mean expression for each mRNA species (as determined by the p or q value) is plotted against the fold change. (D) Total protein levels (mean ± SE). (E) Differential expression profile of SILAC analysis. For each protein, the mean abundance in the wild-type strain (y-axis) is plotted against the corresponding value in the Δdps strain (x-axis). Colors represent the fold-difference between the two strains. (F) The significance of the shift in mean expression for each protein species (as determined by the p or q value) is plotted against the fold change. See also Figures S2 and S3.
