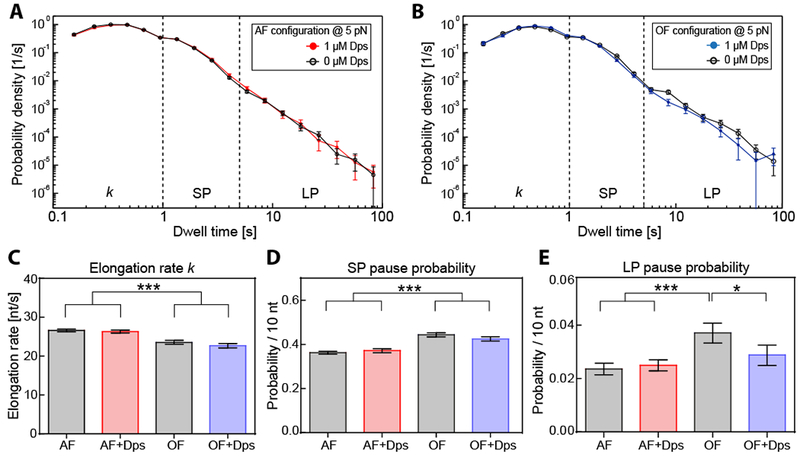
Figure 5. Dependence of transcription elongation dynamics on force and location of DNA:Dps complex.

(A) Dwell time distributions for assisting force (AF) trajectories in the presence (red) and the absence (black) of 1 μM Dps at 20°C. (B) Dwell time distributions resulting from the opposing force (OF) experiments in the presence (blue) and the absence (black) of 1 μM Dps at 20°C. (C) Comparison of extracted RNAP elongation rates k for AF and OF experimental distributions shown in (A, B), determined by Galton distribution fits with an upper boundary of 1 s. (D, E) Calculated transcription pause probabilities (per 10 nt) for short (SP, D) and long pauses (LP, E) for the experimental configurations shown in (A, B). The error bars represent the SD. Statistical results, dwell times, and number of trajectories measured are summarized in Table S2. See also Figure S7.
