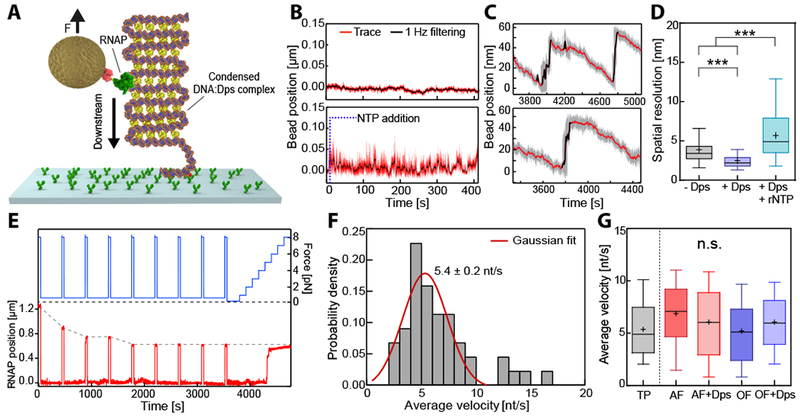
Figure 6. RNAP transcribes through a fully condensed DNA:Dps complex.

(A) The experimental configuration was similar to the OF configuration (see also Figure 4B) but at lower exerted force (0.7 pN), which allows Dps to condense the entire DNA tether. (B) Bead position traces for stalled RNAP on a condensed DNA:Dps complex, before (upper panel) and after (lower panel) transcription restarted upon the addition of rNTPs. (C) Two representative time traces of active RNAP on a condensed DNA:Dps complex. Steep upward jumps in bead position (black) were accompanied by gradual downward displacements (red). (D) Comparative box plot of noise levels (standard deviation) measured in the absence (grey) and in the presence of Dps prior to (purple) or following rNTP addition (cyan). (E) Example trace with transient pulling to 8 pN (blue) every 400 s to determine the absolute RNAP position (red) along the DNA tether. (F) Distribution of average velocities from (E). The red line indicates a Gaussian fit. (G) Comparative box plot of average velocities determined from the transient pulling (E) and transcription experiments for AF and OF configurations in the presence and the absence of Dps (see Figure 5). The outer confidence intervals of the box plots represent the 1.5 interquartile range. See also Figure S6.
