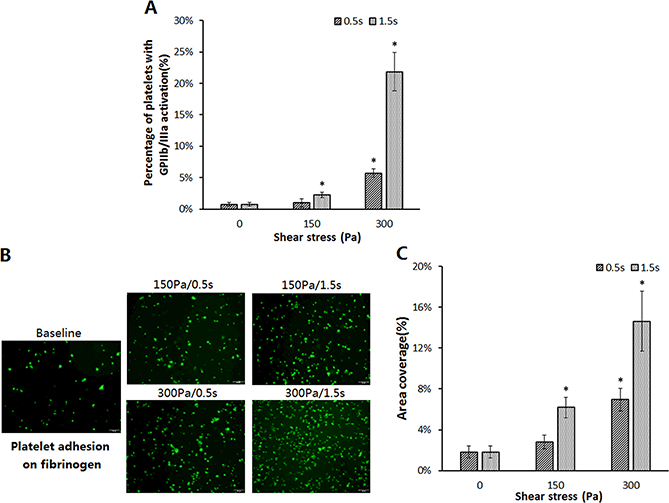
Figure 3.

Comparison of platelet activation and platelet adhesion on fibrinogenin the baseline sample and sheared samples. (A)The percentage of activated platelets indicated by the GP IIb/IIIa activation in the baseline and sheared blood samples (n=6, *P<0.05);(B)Representative fluorescence images of platelet adhesion on fibrinogen from the baseline and four sheared samples (magnification, X400). All scale bars = 20μm; (C) The comparison of the area coverage (ten images taken from the each glass tube) of adherent platelets on fibrinogen for the baseline and four sheared samples (n=6, *P<0.05).
