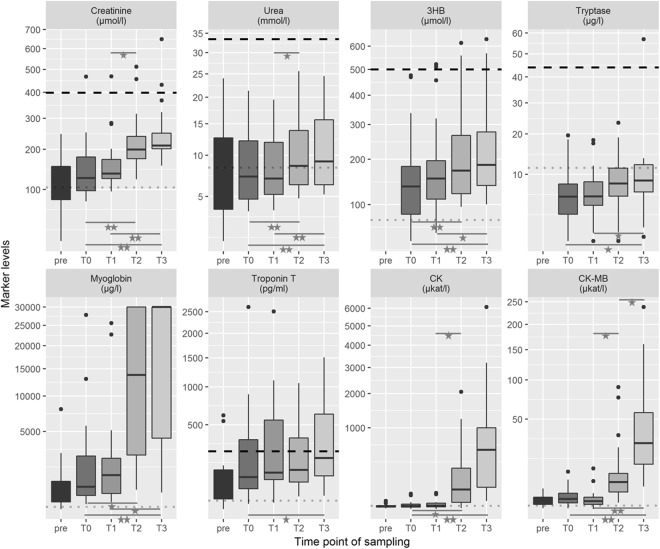
Figure 2.
Box plot diagrams for the biochemical markers tested, listed by their time point of sampling (T0 defined as moment of death). The outlines of the boxes indicate the 25% and 75% percentile, the solid black line the median. End of lines show the minima and maxima. Outliers (>1.5 times interquartile range) were presented as bold points. Values outside the measurement ranges (detected for tryptase, n = 2; myoglobin, n = 17; and troponin T, n = 2) were defined as maximum or minimum of the limits. For better visualization, troponin T values > 20,000 pg/ml (n = 2) were not illustrated in the diagram but were included in all statistical calculations. ‘Pre’ means clinical sampling during resuscitation attempts by emergency doctors. The dotted thin line in grey illustrate the clinical reference value, whereas the dashed thick line in black represents published post-mortem cut-off values (for references see text). *p < 0.05; **p < 0.001 using Friedman test followed by post-hoc Conover and Bonferroni adjustment. 3HB, 3-β-hydroxybutyrate; CK, creatin kinase.

