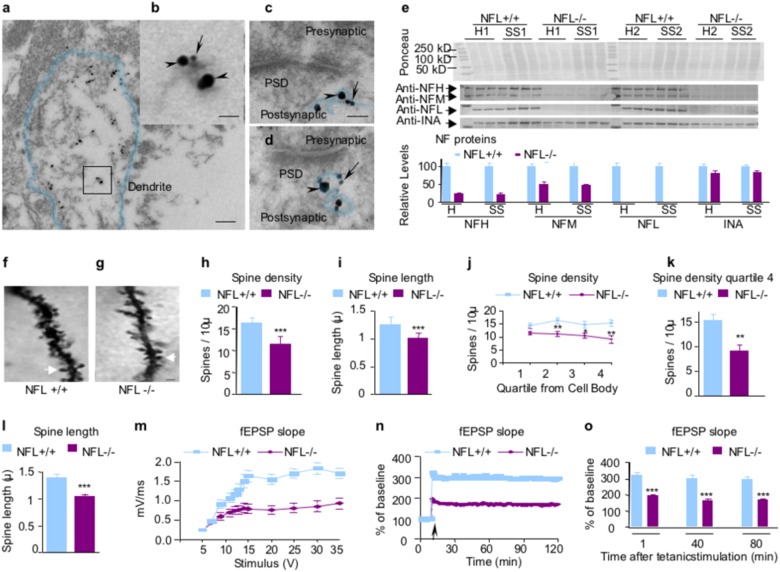
Fig. 1. Reduced dendritic spine length and density and impaired CA1 LTP in the hippocampus of NFL−/− mice.
Ultrastructural colocalization of NFL (arrowheads) and NFH (arrows) on the same NF within dendrites a, b and postsynaptic terminals c, d by immunogold electron microscopy. Dendrite boundaries and postsynaptic neurofilaments are outlined to clearly indicate the morphology. PSD: postsynaptic density. Scale bars, 150 nm in a; 30 nm in b; 40 nm in c, and d. Protein extracts prepared from total hippocampus homogenate and hippocampal synaptosomal fractions were separated on an 8.5% SDS-polyacrylamide gel and transferred to nitrocellulose membrane. Membranes were blotted with different antibodies. NFL were undetectable in NFL−/− mice e. NFH and alpha-internexin in NFL−/− mice were reduced to 22 and 82% of wild-type level, respectively, in both total homogenate and synaptosomes. NFM was reduced to 50% in total homogenate and 47% of wild-type level in synaptosomes, respectively. Data are expressed as Mean ± SEM, n = 6. H: homogenate; SS: synaptosomal fractions. Spine density was compared between NFL+/+ and NFL−/−. Spine density is expressed as the number of spines per 10 microns of dendrite. f, g Spine density on CA1 pyramidal neurons was reduced on dendrites in NFL−/− (p < 0.0001) h. Spine length is expressed as microns per spine. Spine length on CA1 pyramidal neurons was also reduced on dendrites in NFL−/− (p < 0.001) i. Data are expressed as mean ± SEM, n = 8. Arrows point to a representative spine in each genotype. Scale bar: 1 µm. Reduction of dendrite length (Supplementary Table S3), dendritic spine density j, k and spine length l in dentate gyrus granule cells of NFL−/− mice. m A summary graph showing the field I/O relationship for NFL+/+ (green) and NFL−/− (red) mice. n A time course of the average of the fEPSP slopes from slices obtained from NFL+/+ and NFL−/− mice. The fEPSP slopes were normalized to the average value during the 10 min prior to stimulation in each experiment. An arrow shows the time of tetanic stimulation (four pulses at 100 Hz with bursts repeated at 5 Hz, and each tetanus including three 10-burst trains separated by 15 s). o A combined plot of the averages of fEPSP slopes at several time points. Each point is the mean ± SEM (n = 7 mice per group, 14–20 slices per group). Two-way ANOVA with Bonferroni’s post hoc test; p < 0.001. *: p < 0.05; **: p < 0.01; ***: p < 0.001

