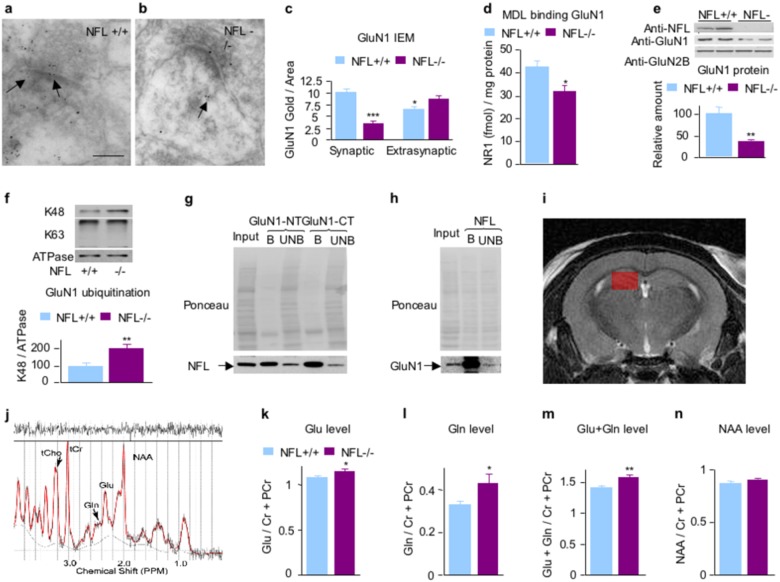
Fig. 2. Reduced GluN1 expression and increased glutamate and glutamine levels in hippocampal 1H MRS metabolite measurements of NFL−/− mice as compared with NFL+/+ controls.
In the absence of NFL, the level of NMDAR–GluN1 subunit in hippocampus was significantly decreased by immuno-EM with anti-GluN1 monoclonal antibody a–c. Scale bar in a, b: 150 nm. *: p < 0.05; ***: p < 0.001. Reduced level of GluN1 was confirmed by decreased binding of GluN1 subunit of NMDAR ligand [3H]MDL105,519 in the hippocampus of NFL−/− mice. P < 0.05, n = 8 d. Western blot with anti-GluN1 antibody also confirmed a reduced level of synaptosomal GluN1 from hippocampi, whereas the level of NR2b subunit was not significantly affected e. f Increased K48-linkage specific ubiquitin signals in GluN1-rich postsynaptic membrane fractions isolated from hippocampal synaptosomes of NFL−/− mice. GluN1-rich postsynaptic membrane fractions prepared from hippocampal synaptosomes were separated on an 8.5% SDS-polyacrylamide gel and transferred to nitrocellulose membrane. Membranes were blotted with K48-linkage-specific ubiquitin antibody and ATPase antibody. Densitometric quantification of immunostained proteins showed that K48-linkage-specific ubiquitin signals normalized to ATPase are significantly increased in the absence of NFL (p < 0.01, n = 8–12), whereas K63-linkage-specific ubiquitin signals was not significantly affected. g, h Co-immunoprecipitation of NFL with GluN1 from hippocampal synaptosomal preparations. GluN1-NT, GluN1 N-terminus antibody; GluN1-CT, GluN1 C-terminus antibody; B, bound; UB, unbound. *: p < 0.05; **: p < 0.01. i The VOI size was 5 µl (1 × 2 × 2.5 mm3) within hippocampus overlaid in red on the coronal anatomical scan. j Representative LCModel output spectrum from the hippocampus of a single NFL−/− mouse showing major labeled metabolites (N-Acetyl aspartate (NAA), glutamate (Glu), glutamine (Gln), total creatine (tCr), and total choline (tCho)). The black line represents the raw data and the red line represents the fit. The plot at the top shows the difference between plots. A good fit should look like random noise with oscillations about zero. k 1H MRS glutamate concentration in NFL−/− versus NFL+/+ mice in the hippocampus showed a significant difference. l, m 1H MRS glutamine and glutamate plus glutamine concentrations in NFL−/− versus NFL+/+ mice in the hippocampus also showed significant differences. n 1H MRS NAA concentration in NFL−/− versus NFL+/+ mice in the hippocampus did not show a significant difference. All data are presented as mean ± SEM (n = 16). *: p < 0.05; **: p < 0.01. Both female and male NFL−/− mice showed similar direction of change in glutamate and glutamine levels as compared with NFL+/+ mice (Supplementary Figure S3) and no significant differences of glutamate levels were observed between gender in NFL+/+ and NFL−/− mice (Supplementary Figure S4)

