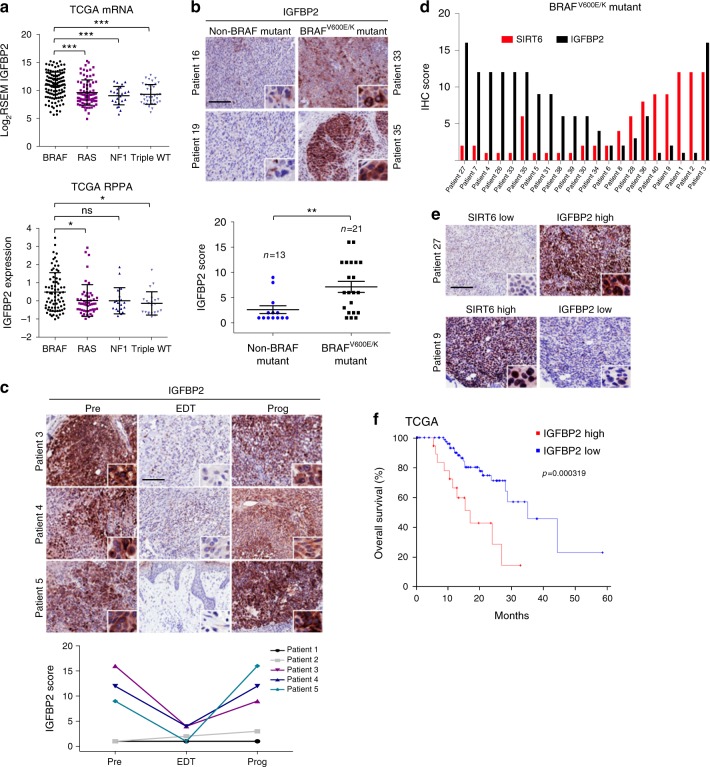
Fig. 5.
IGFBP2 represents a potential biomarker for MAPKi resistance in BRAF mutant melanoma. a IGFBP2 mRNA expression from TCGA samples classified by mutational status (top). IGFBP2 protein expression (RPPA) from TCGA samples classified by mutational status (bottom). Data are mean ± SD; *P < 0.05, ***P < 0.001; One-way ANOVA was used for comparisons. b IHC (immunohistochemistry) for IGFBP2 in non-BRAF mutant or BRAFV600E/K mutant melanoma tissue (Supplementary Data 5). Images ×10 magnification; insets ×40 magnification. Scale bar represents 100 µm. Scores obtained by multiplying the percentage of positively stained cells (1–4) by intensity of stain (1–4). Data are mean ± SEM; **P < 0.01; Mann–Whitney (two-tailed) was performed for comparison. c IHC for IGFBP2 in matched tumor samples (Patients 3, 4, and 5; Supplementary Data 5) taken before treatment (Pre), early during treatment (EDT), and on disease progression (Prog). Images ×10 magnification; insets ×40 magnification. Scale bar represents 100 µm. Scores obtained as in b. d IHC scores of SIRT6 and IGFBP2 in 21 BRAFV600E/K melanoma tissues (Supplementary Data 5); Scores obtained as in b; Spearman’s r = −0.462; P = 0.035. e Representative IHC for SIRT6 and IGFBP2 in BRAFV600E/K melanoma tissues. Images ×10 magnification; insets ×40 magnification. Scale bar represents 100 µm. Scores obtained as in b. f Overall survival stratified by IGFBP2 protein expression (RPPA) from TCGA samples (primary tumors, n = 92). High IGFBP2 protein level in red; z-score threshold > 0.5 or low IGFBP2 protein level in blue; z-score threshold < 0.5. P-values, log rank test

