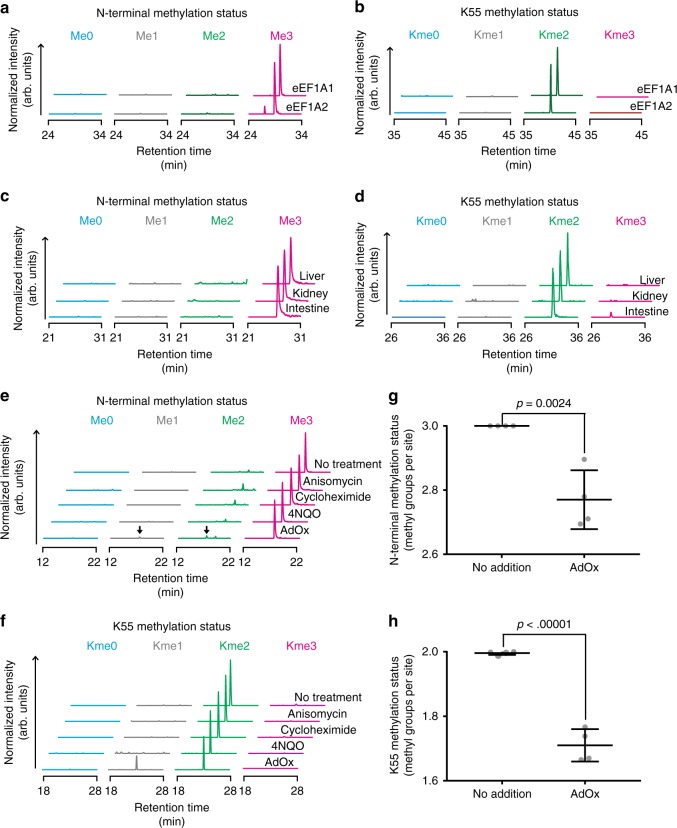
Fig. 6.
METTL13-mediated methylation in cells and tissues. a, b Individual assessment of the methylation status of eEF1A1 and eEF1A2 in human cells. FLAG-tagged eEF1A1 and eEF1A2 were overexpressed in HEK-293 cells and the methylation status of the N terminus (a) and Lys55 (b) was assessed by MS. c, d Assessment of the methylation status of eEF1A proteins in a panel of rat tissues. Same as in previous panels, but ion chromatograms represent the collective methylation status of both eEF1A1 and eEF1A2 in rat liver, kidney, and intestine. e, f Assessment of eEF1A methylation in HeLa cells stressed by various compounds. Ion chromatograms representing the methylation status of eEF1A in cells treated with anisomycin, cycloheximide, 4NQO, and AdOx are shown. Peaks corresponding to the mono- and dimethylated forms of the eEF1A N terminus are indicated (arrow). g, h Quantitative analysis of eEF1A methylation in HeLa cells treated with AdOx. Significance was assessed using a two-tailed t-test and error bars represent the s.d., n = 4

