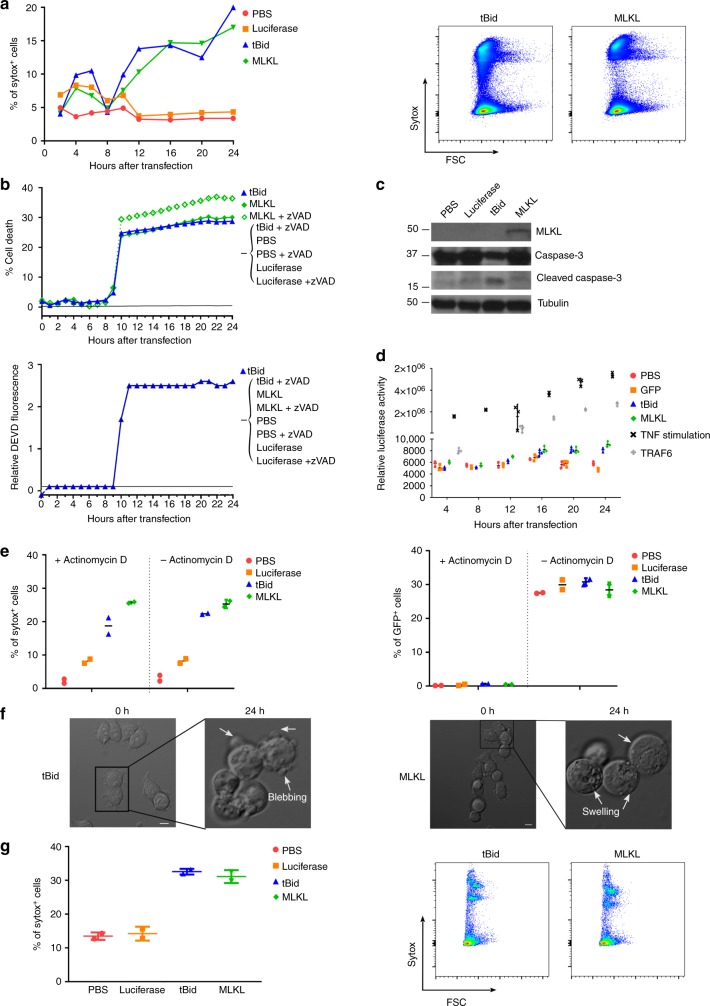
Fig. 1.
MLKL encoding mRNA induces cell death in vitro and in vivo. a–f In vitro cell death characterization. B16-OVA cells were transfected with PBS or with Fluc-, tBid-, or MLKL-mRNA. a At different time points after transfection, cells were collected and analyzed by flow cytometry. Graph showing the percentages of sytox+ cells (left). Representative flow cytometric plots 24 h after transfection (right). b Impact of the pan-caspase inhibitor zVAD-fmk on cell death induction (top) and caspase activity (bottom) upon transfection of B16-OVA cells with tBID- or MLKL-mRNA. c Western blot analysis of the expression of MLKL, caspase-3, and cleaved caspase-3 in cell lysates prepared 24 h after mRNA transfection. Tubulin served as a loading control. d B16 cells were co-transfected with luciferase NF-κB reporter plasmid and a plasmid expressing β-galactosidase. Twenty four hours later, the cells were transfected with PBS, GFP-, tBid-, or MLKL-mRNA or, as a positive control for NF-κB activation, with TRAF6 expression vector or they were stimulated with TNF. The normalized luciferase activity in the lysates determined at different time points after mRNA transfection is depicted. e B16 cells were transfected with a GFP expression plasmid. Twenty four hours later, the cells were transfected with PBS, Fluc-, tBid-, or MLKL-mRNA and the cells were treated or not with actinomycin D as indicated. Twenty four hours after mRNA transfection, cell death and GFP expression were quantified using flow cytometry. Horizontal lines indicate the mean. f Still images of B16-OVA cells at 0 and 24 h after transfection with tBid- or MLKL-mRNA visualized by time-lapse microscopy (scale bar = 10 µm). g In vivo cell death characterization. Subcutaneously growing B16-OVA tumors were injected with PBS or with 10 µg mRNA encoding Fluc, tBid, or MLKL followed by electroporation. Twenty four hours later, the tumor cells were isolated and analyzed by flow cytometry for sytox uptake. Graph showing the percentages of sytox+ cells (left) and representative flow cytometry plots (right). Horizontal lines indicate the mean

