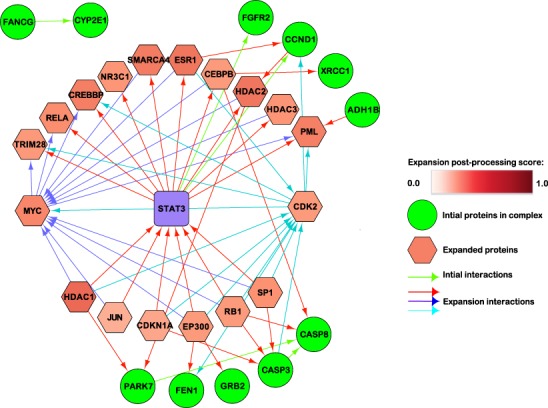
Figure 6.

Protein-protein interactions. Hexagonal red nodes correspond to proteins that were added by PEPPER algorithm (expansions), the red shades of the hexagonal nodes correspond to the scores of relevance computed in the post-processing step. The purple square represents a protein of interest (bait, which is STAT3 in this case). The rounded green nodes represent the list of input proteins (preys). The green edges represent the initial interactions between the seeds (bait and preys). The red, dark and light blue edges are used to represent the interaction between the seeds and the expansions.
