Fig. 2.
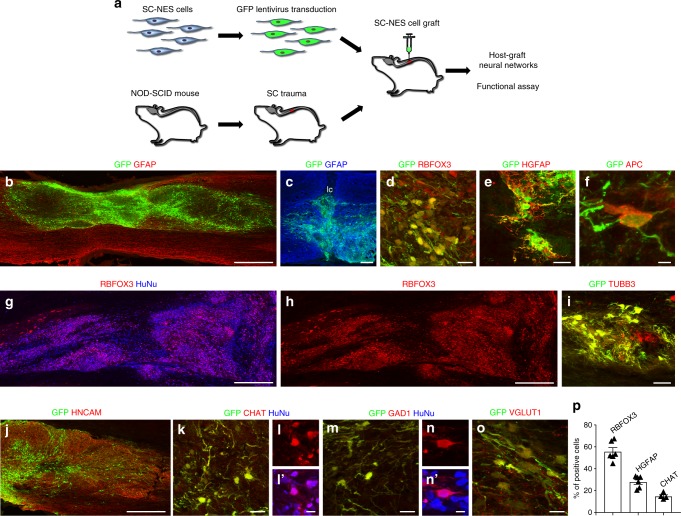
Human SC-NES cell graft survival and in vivo differentiation in a model of SCI. a Schematics of the experimental procedure. SC-NES cells were transduced with a GFP lentiviral construct before engraftment. Recipient immunodeficient (NOD/SCID) mice underwent dorsal SC hemisection and received SC-NES cell injection onto the lesion site 10 days after. b GFP-labeled SC-NES cells were implanted into the site of the injury. Horizontal section immunolabelled for GFP and GFAP indicates that cell implants survive and distribute into the lesion cavity. Rostral is to left, caudal is to right. c High magnification of the lesion core (lc) showing the correct placement of the cells in the injured area. d The majority of the cells within the graft differentiates toward the neuronal fate giving rise to RBFOX3-positive neurons. e, f SC-NES cells also generate astrocytes positive for human GFAP (HGFAP) and oligodendrocytes positive for APC. g, h Low magnification image of grafted cells immunostained with RBFOX3 and human nuclei (HuNu) antibodies, confirming the human origin of differentiated cells. i, j Grafted GPF-labeled cells are also positive for the neuronal markers TUBB3 and HNCAM. k–l′ A fraction of GFP-labeled SC-NES cells colocalize with the motor neuronal marker choline acetyltransferase (CHAT) and co-staining with HuNu antibody confirms the human origin of the cells. m–n′ Immunostaining for GFP, HuNu and the inhibitory neuronal marker glutamate decarboxylase 1 (GAD1) showing colocalization of GAD1 staining with GFP and HuNu. o Double labeling for GFP and vesicular glutamate transporter 1 (VGLUT1) showing a graft-derived human neurite co-expressing VGLUT1. p Quantification of RBFOX3-positive neurons (55.6 ± 3.6%) and HGFAP-positive astrocytes (27.9 ± 2.2%) representing the two largest cellular subtypes in the graft. Among neurons, CHAT-positive motor neurons were the most abundant subtype accounting for up to 14.7% of grafted cells. Scale bars: b 500 µm; c 200 µm; d 20 µm; e 40 µm; f 4 µm; g, h 500 µm; i 40 µm; j 250 µm; k 20 µm; l, l′ 10 µm; m, 20 µm; n, n′ 10 µm; o, 20 µm

