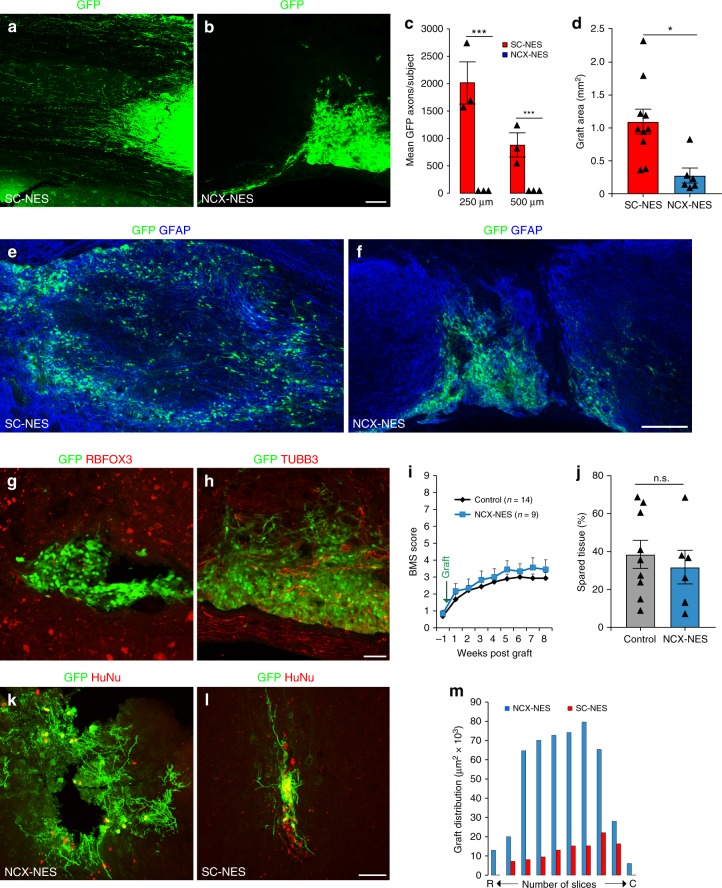
Fig. 6.
Regionally matched NES cell grafts integrate in the lesioned SC. a GFP immunostaining of human SC-NES cells grafts in the lesioned SC 8 weeks after implantation. SC-NES cells integrate in the tissue and show a massive axonal elongation. b GFP immunostaining of human NCX-NES cell grafts. The cells form tight clusters in the host SC with a poor axonal extension. c Quantification of GFP-positive axons per subject in SC- and NCX-NES cell transplants. The plot indicates the number of axons at 250 and 500 µm from the caudal graft-host interface. d Quantification of SC- and NCX-NES cell graft areas. e, f GFP and GFAP staining of SC- and NCX-NES cell grafts at the injection site showing a larger extension of SC-NES cell grafts in the host tissue. g, h Grafted NCX-NES cells are negative for the pan-neuronal markers RBFOX3 and TUBB3. i Hindlimb locomotion: BMS scores of NCX-NES cell recipient animals (n = 9) and control animals (n = 14) suggesting a lack of functional recovery in treated animals. j Spared tissue quantification in control and NCX-NES cell grafted mice. The histogram shows that the extent of the lesion in both groups is not statistically different. k, l GFP and human nuclei (HuNu) immunostaining of NCX-NES cells implanted in the motor cortex of immunodeficient mice two months after surgery. m Rostro (R)-caudal (C) spread and graft extension in the coronal plane two months after engraftment of SC- and NCX-NES cells into the motor cortex of adult immunodeficient mice. Data are expressed as mean ± s.e.m (*P < 0.05; ***P < 0.001; Student’s t-test). Scale bars: a, b, 500 µm; e, f, 200 µm, g, h, k, l, 50 µm

