Fig. 7.
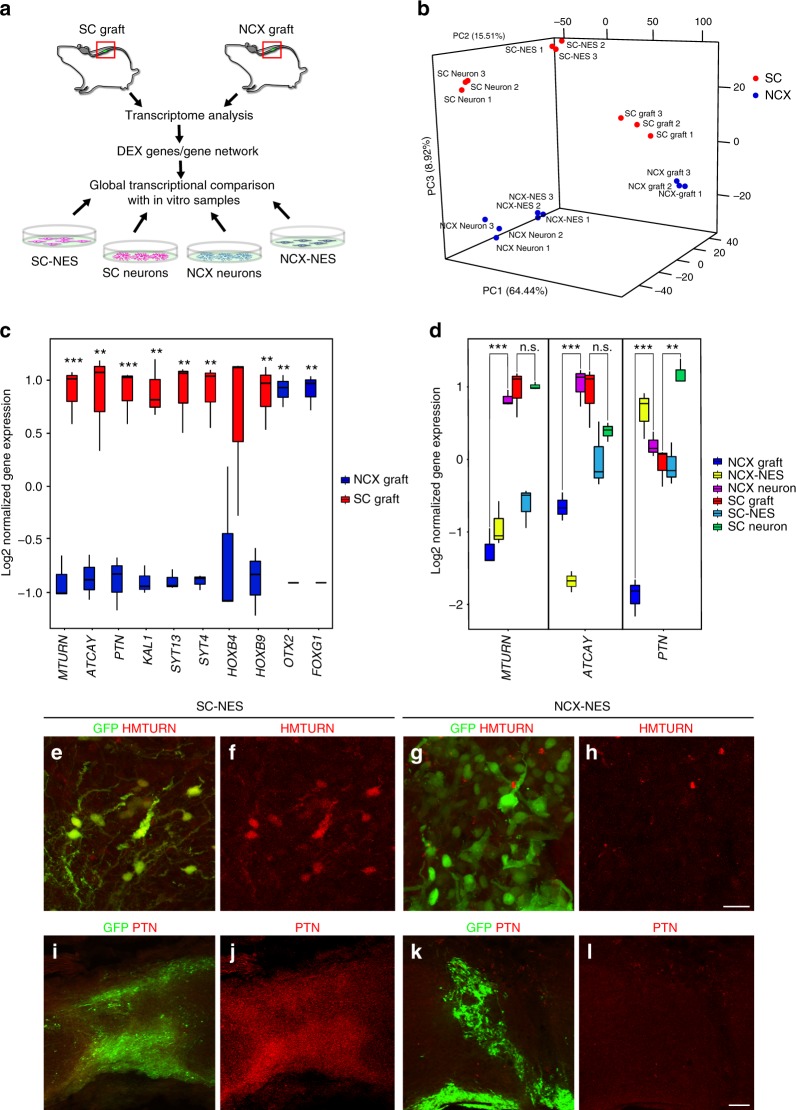
Global transcriptome analysis reveals SC-NES cell neuronal commitment after transplantation. a Schematics of the experimental procedure. SC- and NCX-NES cell grafts were isolated from recipient mice 8 weeks after implantation. RNA-seq was performed to identify differentially expressed (DEX) genes in the two samples. The expression level of DEX genes was eventually compared with in vitro samples: proliferating cells from both SC and NCX (SC-NES; NCX-NES), and cells upon 8 weeks of differentiation (SC Neurons; NCX Neurons). b 3D plot of the principal component analysis (PCA) of SC- and NCX-NES cells in proliferation (NES), after in vitro differentiation (neuron) or in vivo transplant for 8 weeks (graft). Each dot represents a sample. c Box plot of normalized gene expression for selected genes in SC- and NCX-NES cell grafts. The black bar within each box represents the median value. Vertical bars indicate the maximum and minimum values. d Box plot of normalized gene expression of maturin (MTURN), caytaxin (ATCAY) and pleiotrophin (PTN) genes across all SC ad NCX samples. The black bar within each box represents the median value. Vertical bars indicate the maximum and minimum value. e–h Human MTURN (HMTURN) and GFP stainings of SC- and NCX-NES cells 8 weeks after engraftment. Samples derived from the SC express HMTURN after grafting, whereas grafted NCX cells are HMTURN-negative. i–l Human PTN (PTN) and GFP stainings confirming the expression of PTN in grafted SC-NES cells and its absence in grafted NCX-NES cells. Scale bars: e–h 20 µm; i–l 50 µm. (**P < 0.01, ***P < 0.001; Student’s t-test)

