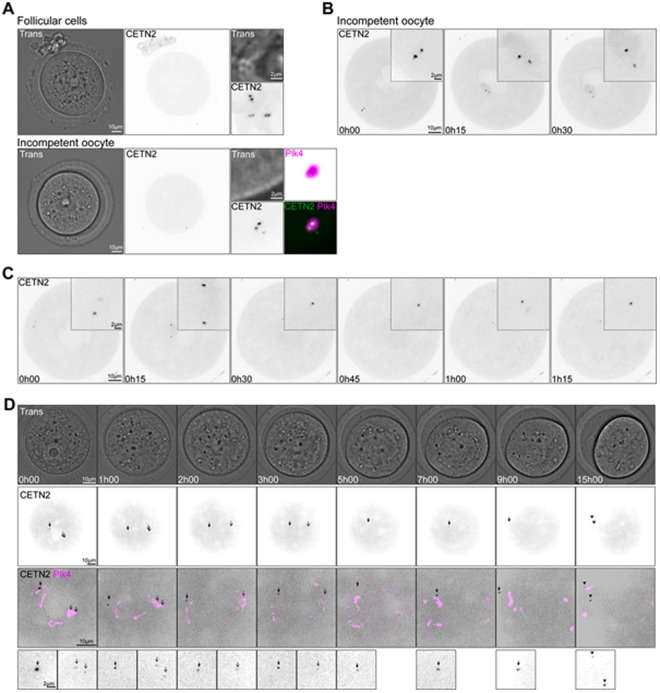
Figure 7.
GFP CETN2 foci present a loose association with the PCM. (A) Transmitted light and fluorescent images of incompetent oocytes and follicular cells expressing GFP CETN2. GFP CETN2 signal (gray) is shown in follicular cells (upper panels) and incompetent oocyte (lower panels). Additional panels for the incompetent oocyte show the co-localization of GFP CETN2 (green) with mCherry-Plk4 (magenta). (B) GFP CETN2 foci (gray) moving from the cortex of the oocyte to the nuclear envelope in an incompetent oocyte. Insets show higher magnifications of the foci. (C) Oocyte followed at prophase I exit. GFP CETN2 appears gray. Insets show higher magnifications of the CETN2 foci. (D) Oocyte observed from prophase I exit to first polar body extrusion by transmitted light (upper panel) and fluorescence emission (lower panels). GFP CETN2 (gray) foci are highlighted with black arrows. Partial co-localization with mCherry-Plk4 (magenta) is shown. (A–C) GFP CETN2-expressing cells from transgenic mice, injected with mCherry-Plk4 cRNA (A). (D) mCherry-Plk4-expressing oocytes from transgenic mice, injected with Venus CETN2 cRNA. Time is expressed in hours and minutes.

