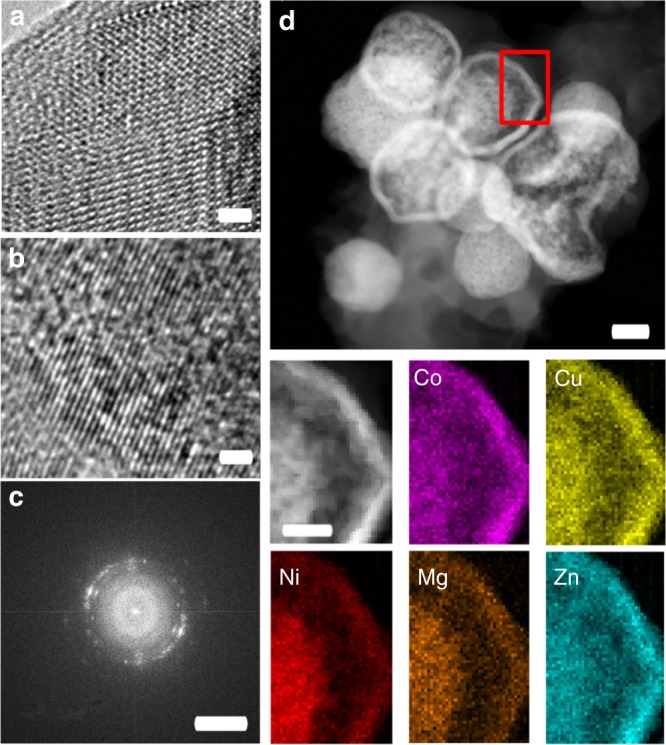
Fig. 4.

HRTEM and EDX analysis of the active material. a, b HRTEM images of the as-prepared and cycled TM-HEO, respectively. The crystallites in b are substantially smaller and do not show order over longer distances. The lattice fringes in b are not completely straight, but show a small divergence from the original axis. Nevertheless, the small regions with dimensions on the order of a few nanometers exhibit lattice fringes oriented in a specific direction, likely due to the former long-range order, which is partially lost during the conversion reaction. c FFT of a HRTEM image of a few crystallites. The arcs in the FFT correspond to the cubic rock-salt structure, but they indicate a certain texture. The lattice fringes are discontinuous between different crystallites; however, the misorientation is small, caused probably by large amounts of defects or low angle boundaries. d STEM image showing the spheres consist of small particles and the respective elemental maps of the area indicated by the red rectangle. No apparent segregation occurs at the length scale of aggregates of nanoparticles. The scalebars in a and b correspond to 1 nm, in c to 5 1/nm, in d to 200 nm and for the compared EDX analysis to 60 nm
