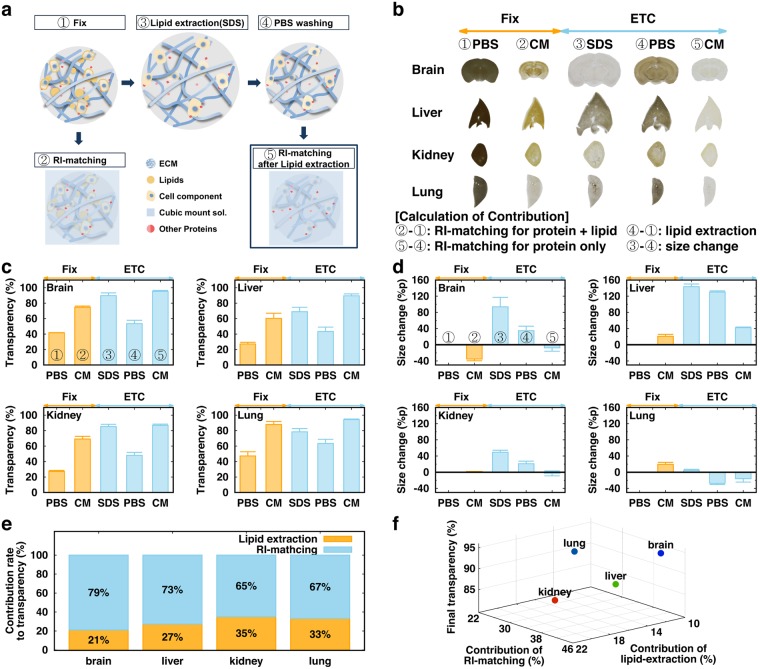
Figure 1.
ACT process and contributions of lipid-extraction, RI-matching, and size expansion to tissue transparency (a) Schematic diagram of refractive index (RI) matching and the active CLARITY technique (ACT) process. (b) Images of 1-mm-thick tissue slices during the tissue-clearing process. Comparison of two different steps provides contributions of each factor (bottom) (c) Transparency of each organ tissue during the tissue-clearing process. (d) Size changes of each organ at each tissue-clearing step. (e) Contributions of RI-matching and lipid extraction to tissue clearing, if the effect of size change on transparency is compensated. (f) 3D plot of contributions of lipid-extraction and RI-matching to tissue transparency. The color indicates the final transparency (red-green-blue). N = 3 for each organ.

