Figure 2.
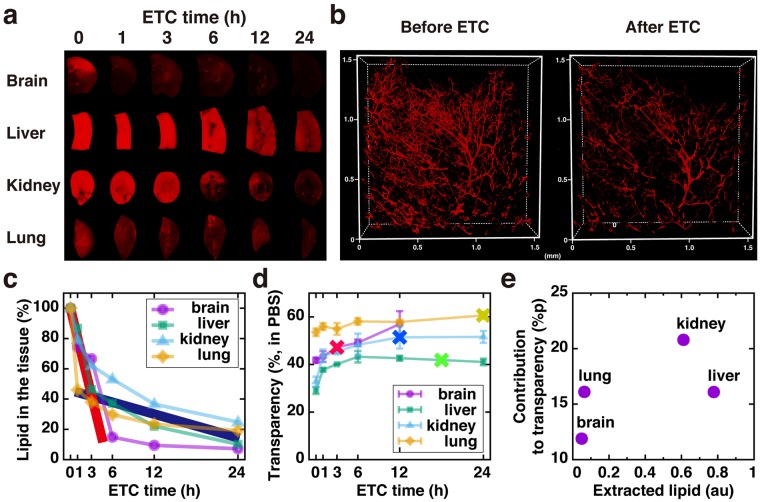
Evaluation of lipid extraction (a) Images of DiI-stained tissue at different ETC time points. (b) Pre-labeled CM-DiI signals remaining in the brain vasculature before (left) and after 2 hr ETC (right). Lipid extraction rate (c) and transparency (d) at different ETC time points. “X” marked points in (d) indicate an optimal time point for each organ for maximal clearing. N = 3, 3, 6, 6 for brain, lung, liver and kidney, respectively. (e) Correlation graph of extracted lipid and contribution of lipid extraction to the improvement of the transparency of each organ.

