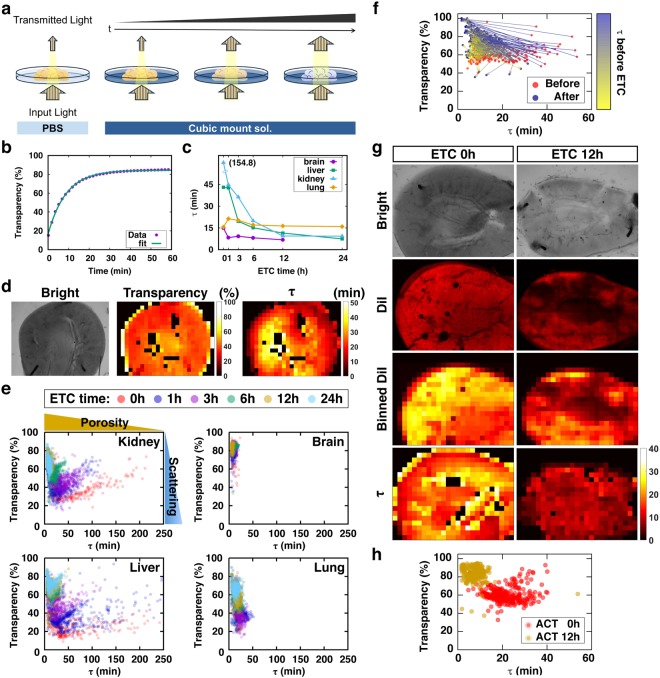
Figure 4.
Molecular diffusion-based evaluation method for tissue clearing (a) Conceptual image showing the evaluation process of tissue clearing with two variables: transparency and time constant (τ) for the diffusion of RI-matching solution. (b) Time-transparency data fitted to one-phase association function to get time constant and final transparency. (c) τ profile of each organ at different ETC time points. (d) Sample images of the same mouse kidney slice: bright-field image (left), transparency map (middle), τ map (right). (e) τ-transparency scatter plot, which could indicate the optical properties of a cleared tissue. Each data points were obtained from 3 independent samples in each organ at each ETC time point. (f) τ and transparency relations for each points of a kidney sample before (red dots) and after 12 hr ETC (blue dots) and their position change (colored arrows). The colors of arrow were from τ values before ETC. (g) Images of mouse kidney at ETC 0 and 12 hr. (h) Scatter plot of τ-transparency from samples in (g).

