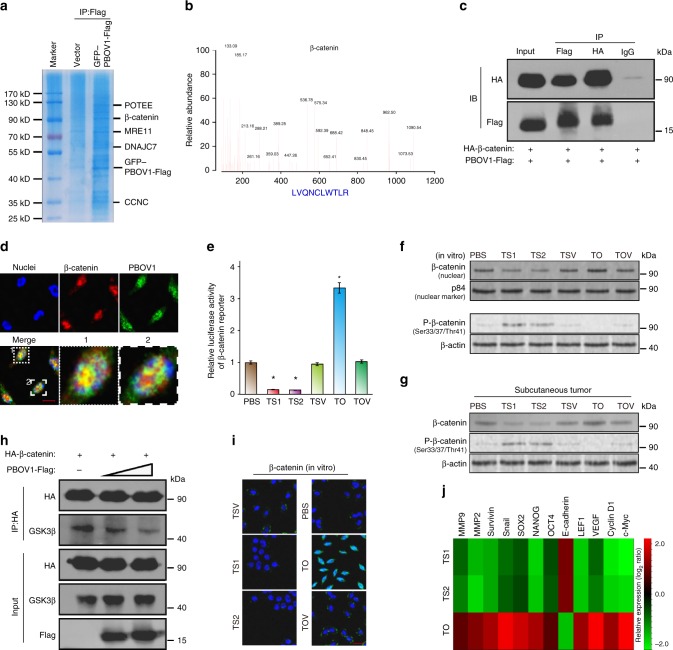
Fig. 7.
PBOV1 binds to β-catenin and activates Wnt/β-catenin signaling. a Representative picture of coomassie blue staining of proteins co-immunoprecipitated with PBOV1. b Representative MS plots and sequences of peptides from β-catenin. c Immunoprecipitation assay confirming interaction between PBOV1 and β-catenin. d Representative confocal images showing colocalization of PBOV1 and β-catenin (Scale bar, 10 μm). e β-catenin luciferase-reporter activities analyzed in various groups of Hep3B cells. Data were represented as means ± S.D. Error bars represent the S.D. values (n = 3; *P < 0.05. Significant differences were analyzed by Student’s t test, compared with PBS control group). f Protein expression levels of β-catenin in the nuclear fraction and Phospho-β-catenin (Ser33/37/Thr41) in Hep3B cells in vitro determined by western blotting assay. P84 and β-actin served as loading control. g Protein expression levels of total β-catenin and Phospho-β-Catenin (Ser33/37/Thr41) in Hep3B subcutaneous tumor tissues determined by western blotting assay. h PBOV1 attenuates interactions between β-catenin and GSK-3β in dose-dependent manner. i Immunofluorescence staining of β-catenin in the indicated Hep3B cells. (Scale bar, 20 μm; Blue, DAPI-indicating nuclei; green, FITC indicating β-catenin protein). j Real-time PCR analysis demonstrating an apparent overlap between β-catenin-dependent gene expression and PBOV1-regulated gene expression. The pseudocolour represents the intensity scale for indicated treatment groups versus PBS control group, calculated by log2 transformation

