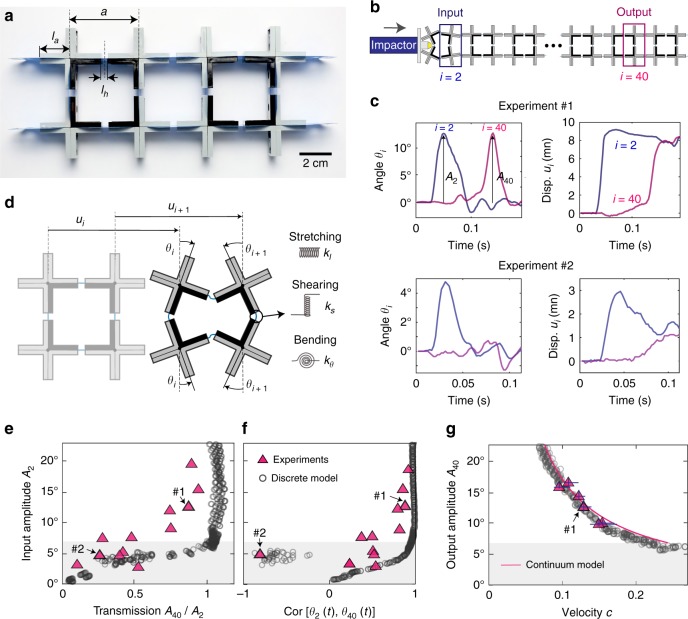
Fig. 1.
Propagation of elastic vector solitons in a chain with all horizontal hinges aligned. a Few units of our sample (Scale bar: 2 cm). b Schematics of our testing setup. c Evolution of the rotation and longitudinal displacement of the second and fortieth units as a function of time during two different experiments. d Schematic of the system. e Measured transmission, A40/A2, as a function of the amplitude of the input signal, A2. f Measured cross-correlation of θ2(t) and θ40(t) as a function of the amplitude of the input signal, A2. g Evolution of the pulse velocity c as a function of its amplitude. The gray region in e–g highlights the amplitude gap as predicted by the continuum model. The error bars in g show the 95% confident interval of the measured velocities and amplitudes of solitons in experiments. The corresponding error bars for simulation results are too small to show

