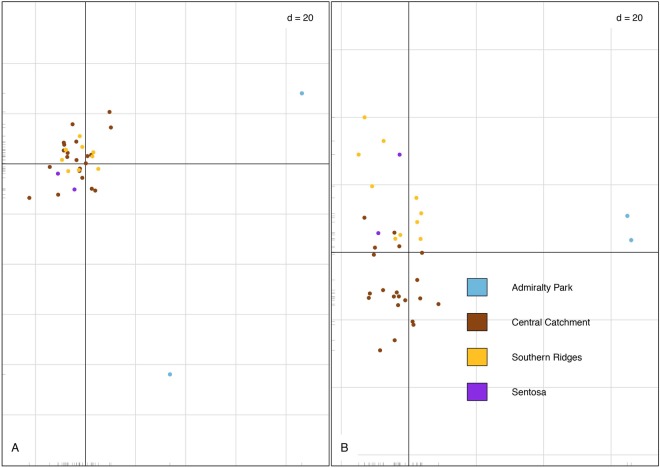
Figure 2.
Principal components analyses of the sampled Striped Tit-Babbler individuals using (A) the kin filtered (n = 35) SNPset with the highly inbred individual from Admiralty Park (K1103) included, and (B) the kin-filtered (n = 35) SNPset with the highly inbred individual from Admiralty Park replaced with its less inbred kin (K1105). For both plots, PC1 and PC2 are plotted, with both plots showing that most of the individuals cluster into a single cloud, and the individuals from Admiralty Park falling out as outliers. The colour scheme follows that of Fig. 1.

