Fig. 2.
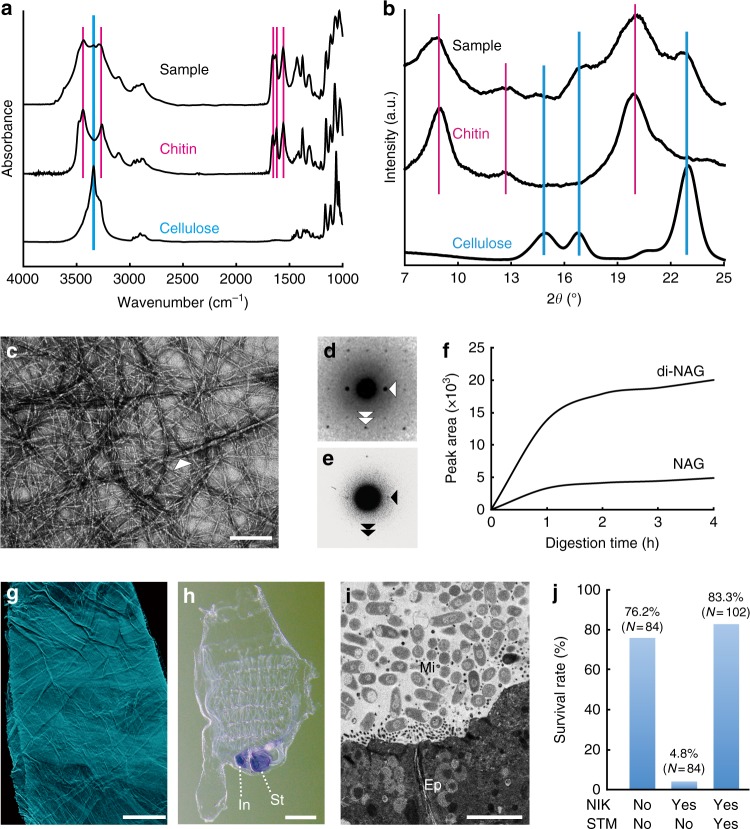
The chitinous framework of Ciona barrier membranes. a, b Spectroscopic and crystalline profiles of the meshed framework purified from Ciona barrier membranes (a, FT-IR spectra; b, X-ray diffractograms). Magenta and cyan vertical lines indicate peak positions that are specific to chitin (α allomorph) or cellulose (Iβ allomorph), respectively. c A negative stain TEM image of a purified framework showing two types of crystalline nanofiber. A white arrowhead indicates a sparse, thick fiber meshed with abundant thin fibers. d An electron diffractogram of a single thick fiber showing cellulose (Iβ allomorph)-specific reflections indexed with the lattice planes (110) (white arrowhead) and (004) (white double arrowhead). e An electron diffractogram of thin fibers, showing chitin-specific signals assigned to the lattice planes (020) (arrowhead) and (002) (double arrowhead). f Mass spectrometry-based time course relative quantification of N-acetylglucosamine (NAG) and N-acetylchitobiose (di-NAG) released from a purified framework under chitinase treatment. For details, see Supplementary Fig. 3. g A purified framework visualized with a fluorescent probe conjugated with a chitin-binding domain protein. h Whole-mount in situ hybridization showing expression of the chitin synthase gene Ci-CHS in the stomach (St) and anterior intestine (In). i, j Barrier membranes are essential for survival. i A TEM image of gut cross-section of the specimen treated with the chitin synthase inhibitor, Nikkomycin Z (30 μM). Intestinal microbes (Mi) directly contact the gut epithelium (Ep). j Reduced survivorship caused by Nikkomycin Z treatment, which can be compensated in aseptic conditions promoted by the antibiotic, streptomycin (50 μg/mL). NIK nikkomycin Z; STM streptomycin. Scale bars c 100 nm; g, h 100 μm, and i 5 μm

