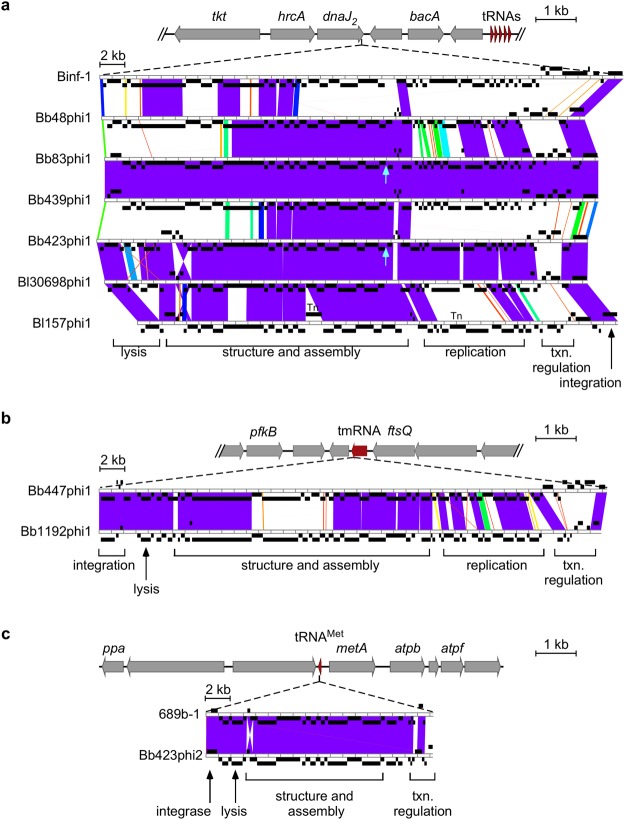
Figure 1.
Bifidoprophage genomic comparison and characterization. (a) (top) Enlarged view of the dnaJ2 integration locus. Coding (grey) and tRNA (red) genes are indicated, oriented in the direction of transcription, and with gene descriptions indicated where applicable. The seven prophages are integrated at the 3′ end of the dnaJ2 gene. (bottom) Genome architecture and mosaic relationships between the seven prophage genomes are highlighted with pairwise alignments in Phamerator. Genes (black boxes) are positioned above or below the genome ruler to indicate orientation. The color spectrum between genomes reflects sequence similarity based on BLAST e-values, ranging from white (no similarity) to violet (high similarity). Cyan arrows indicate area of lowest sequencing coverage from the induced virion genome indicating the location of the linear virion genome termini. General regions of specific gene modules are indicated below the alignment. Tn = transposase. (b) (top) Enlarged view of the tmRNA integration locus, as in panel (a). The prophages are integrated at the 3′ end of the tmRNA gene. (bottom) Genome architecture and mosaic relationships between the prophage genomes, as in panel (a). (c) (top) Enlarged view of the tRNAMet integration locus, as in panel (a). The prophages are integrated at the 3′ end of the tRNAMet gene. (bottom) Genome architecture and mosaic relationships between the prophage genomes, as in panel (a). Note: in each panel, the host and prophage genome maps are on different scales.

