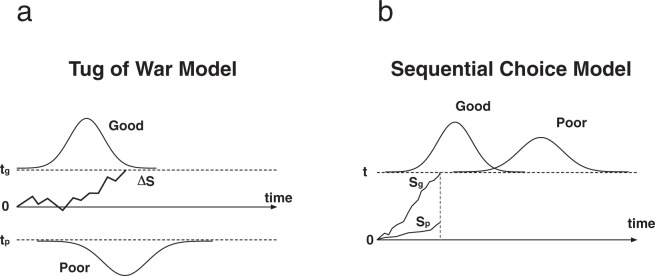
Figure 1.
Illustrations of the accumulation of evidence over time for competing options in the tug-of-war model (a) and the sequential choice model (b). In the ToW model, a decision is made when the difference of signals (ΔS) between the options reaches one of the thresholds (tg or tp). In the SCM, each signal accumulates independently, and a decision is made when one of them reaches the single threshold (t). The good and poor curves represent frequency distributions of decision-making latencies observed for each option when it is the only one present. This figure is recreated based on Kacelnik et al.28.

