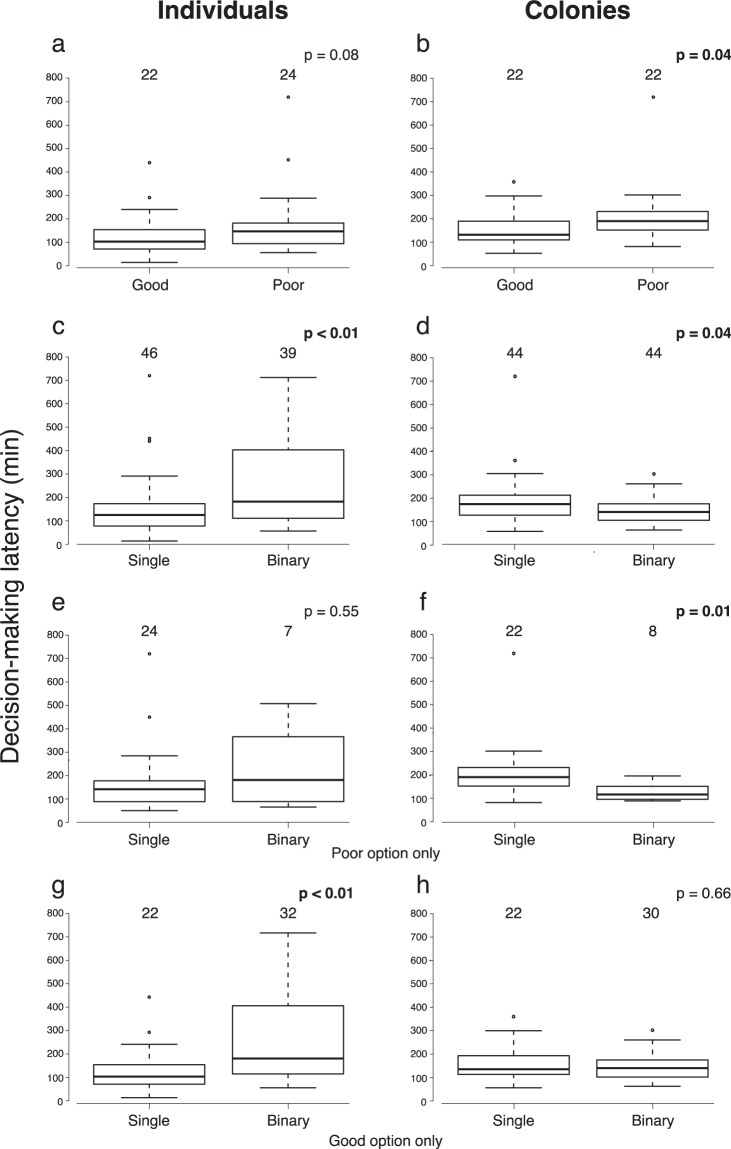
Figure 2.
Decision-making latencies for individuals (left column) and colonies (right column). (a,b) comparison between the good option and the poor option when a single option is present, (c,d) comparison between the single option condition and the binary choice condition, (e,f) comparison between the single option condition in which the poor option was present and the binary choice condition in which subjects chose the poor option, (g,h) comparison between the single option condition in which the good option was present and the binary choice condition in which subjects chose the good option. Each box extends between the lower and upper quartiles, a horizontal line within the box indicates the median, and whiskers show the range of the data, except for outliers indicated by open circles. Each number above a box is a sample size for the group. Within each panel, the latencies were compared using a Mann-Whitney U test (significant p values are shown in bold).

