Figure 1.
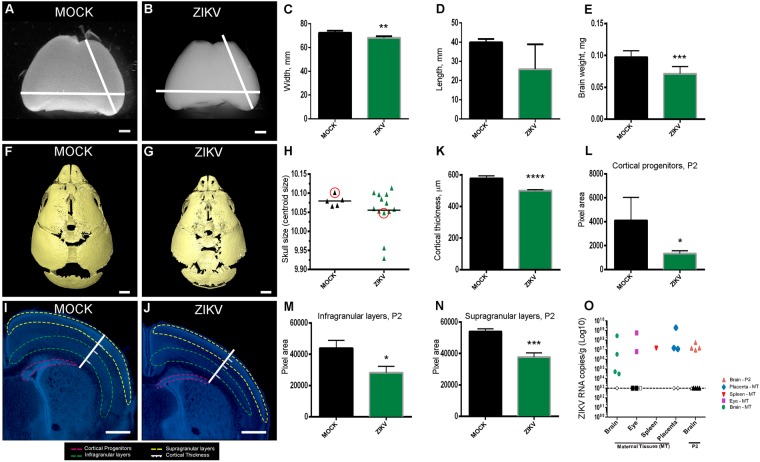
Reduced brain length, area and weight at P2 following ZIKV infection Light microscope image of P2 MOCK (A) or ZIKV infected (B) whole brain, showing reduced cortical length and lateral width (C) and length (D); (E) ZIKV infected brains show a significant decrease in brain weight compared to MOCK brains at P2. Brains were obtained from three litters, n = 12. Student’s t-test **p < 0.01 in C; ***p < 0.001 in E. CT reconstructed skulls of MOCK (F) and ZIKV (G) P2 pups injected IV at E12.5. Scale bar = 1 mm (H) Quantification of skull size obtained P2 animals from three litters, n = 18. Circles represent the skulls in F and G. DAPI stained sections of MOCK (I) and ZIKV infected (J) brains with white measurement bars for illustration of cortical thickness, with boundaries for normotypical white matter and cortical layer 4 marked. Cortical progenitor area is highlighted in pink, infragranular layers in green and supragranular, in yellow. (K) ZIKV brains show a significant decrease in cortical thickness compared to MOCK brains; Scale bars A, B = 1 mm; C, D = 500 µm. (L) ZIKV infected P2 brains show a significant decrease in thickness compared to MOCK brains in the cortical progenitor layers, infragranular layers (M) and supragranular layers (N). Brains were obtained from three litters, n = 12. Student’s t-test ****p < 0.0001 in K; *p < 0.05 in L and M; ***p < 0.001 in N. (O) ZIKV RNA was quantified by qRT-PCR from maternal brain, eye and spleen and P2 brain tissues collected 9 days post infection. Closed symbols indicate MOCK mice, open symbols indicate ZIKV infected mice and dotted line represents the limit of detection. Tissues were obtained from n = 5 adults and n = 7 pups.

