Figure 2.
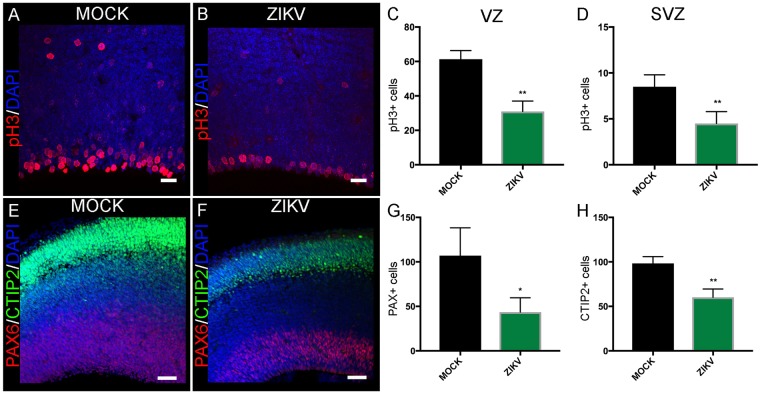
ZIKV infection was associated with reduced neurogenic proliferation Confocal images showing pH3 and DAPI co-stained in MOCK (A) and ZIKV (B) infected E15.5 brain sections. Data presented here as the mean ± SEM from sections prepared from three embryos obtained from three litters for each condition in this analysis and subsequent quantifications, unless stated otherwise. There is a significant decrease in pH3+ cells in VZ (C) and SVZ (D) of dorsal cortex in ZIKV infected brains compared to MOCK brains. MOCK, n = 184 cells; ZIKV, n = 93 cells, Student’s t-test **p < 0.01 in C and MOCK, n = 50 cells; ZIKV, n = 36 cells in D, Student’s t-test **p < 0.01. Confocal images showing Pax6, Ctip2, and DAPI co-stained in MOCK (E) and ZIKV (F) infected E15.5 brain sections. There is a significant decrease in Pax6+ (G) and Ctip2 (H) cells in ZIKV infected brains compared to MOCK brains at E15.5. MOCK, n = 321 cells; ZIKV, n = 174 cells, Student’s t-test *p < 0.05 in G and MOCK, n = 295 cells; ZIKV, n = 241 cells in H, Student’s t-test **p < 0.01. Scale bar = 20 μm.

