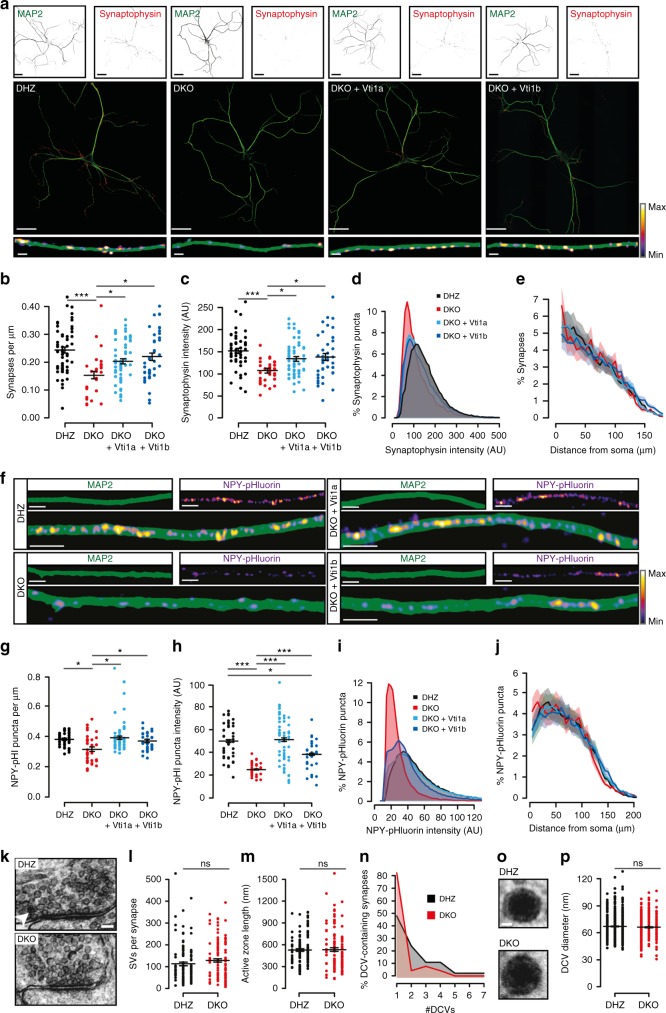
Fig. 1.
Vti1a/b-deficient neurons have shorter neurites and contain less synapses and DCVs. a Representative examples of single DIV-14 neurons immunostained for MAP2 and Synaptophysin-1. b Lower synapse density in DKO neurons (DHZ: 0.24 ± 0.01, n = 57; DKO: 0.15 ± 0.01, n = 32; DKO + Vti1a: 0.20 ± 0.01, n = 60; DKO + Vti1b: 0.22 ± 0.01 synapses/µm dendrite, n = 43; Kruskal–Wallis). c Reduced Synaptophysin-1 puncta intensity in DKO neurons (DHZ: 151.71 ± 8.82, n = 57; DKO: 106.96 ± 5.16, n = 32; DKO + Vti1a: 133.47 ± 5.24, n = 60; DKO + Vt1b: 137.75 ± 8.09 AU, n = 43; ANOVA). d Histogram showing higher proportion of low-intensity Synaptophysin-1 puncta in DKO neurons. e Sholl analysis showing similar synapse distribution, with a non-significant increase at 5 µm in DKO (6.40 ± 0.46) compared to DHZ (5.01 ± 0.33), DKO + Vti1a (5.29 ± 0.34) and DKO + Vti1a (4.76 ± 0.29%; Kruskal–Wallis). f Representative stretches of single DIV-14 neurons expressing NPY-pHluorin and immunostained for MAP2. g Reduced NPY-pHluorin puncta density in DKO neurons (DHZ: 0.38 ± 0.01, n = 42; DKO: 0.32 ± 0.02, n = 37, DKO + Vti1a: 0.39 ± 0.01, n = 59; DKO + Vti1b: 0.37 ± 0.01 puncta/µm neurite, n = 34; Kruskal–Wallis). h Reduced NPY-pHluorin puncta intensity in DKO neurons (DHZ: 49.8 ± 12.0, n = 42; DKO: 24.9 ± 4.4, n = 37, DKO + Vti1a: 51.0 ± 15.7, n = 59; DKO + Vti1b: 38.3 ± 9.7 AU, n = 34; Kruskal–Wallis). i Histogram showing reduced NPY-pHluorin puncta intensity in DKO neurons. j Sholl analysis showing similar distribution of NPY-pHluorin puncta between groups. k Representative synaptic micrographs of single DIV-14 neurons. Arrowhead points at DCV. l Similar amount of SVs per synapse between DHZ (113.53 ± 7.71, n = 122) and DKO neurons (129.28 ± 8.11, n = 119; Mann–Whitney). m Similar active zone length between DHZ (527.17 ± 18.67, n = 122) and DKO neurons (534.20 ± 25.26 nm, n = 119; Mann–Whitney). n Histogram of DCVs per synapse in DCV-containing synapses showing more DCVs in DHZ (2.11 ± 0.22) than DKO neurons (1.35 ± 0.17). o Representative examples of DCVs. p Similar DCV diameter between DHZ (67.11 ± 0.48, n = 626) and DKO neurons (66.17 ± 0.50 nm, n = 502; Mann–Whitney). Bars show mean ± SEM. Scatterplots and columns represent individual neurons and litters, respectively.*p < 0.05; **p < 0.01; ***p < 0.001. Scale bar = 40 µm (a, overview), 2 µm (a, zoom), 5 µm (h), 100 nm (k), 20 nm (o). Intensity color-code used for Synaptophysin-1 zooms and NPY-pHluorin

