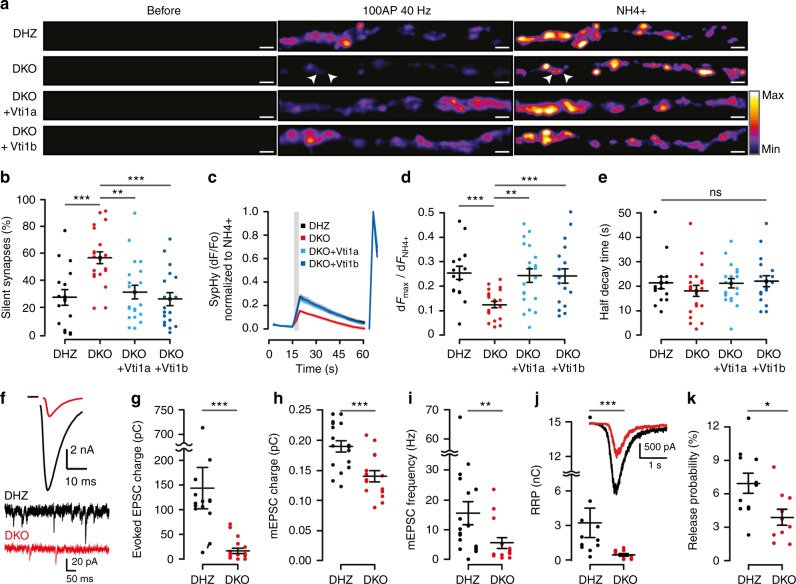
Fig. 2.
SV fusion is impaired in Vti1a/b-deficient neurons. a Examples of SypHy-labeled synapses from single DIV-14 neurons before, during HFS (100AP, 40 Hz) and NH4+ superfusion. Arrowheads point at examples of silent synapses. Intensity color-code used for SypHy. Scale bar = 2 µm. b Increased percentage of silent synapses in DKO neurons (DHZ: 56.65 ± 4.45, n = 17; DKO: 27.28 ± 5.77, n = 21; DKO + Vti1a: 31.21 ± 5.14, n = 20; DKO + Vti1b: 26.03 ± 4.95%, n = 19; ANOVA). c Average SypHy traces of SV fusion in responsive synapses upon HFS (gray rectangle) normalized to the maximum intensity upon NH4+ superfusion (right traces). Shaded regions indicate SEM. d Reduced fraction of SV fusion in responsive synapses, measured as maximum HFS intensity over NH4+ response, in DKO neurons (DHZ: 0.25 ± 0.03, n = 17; DKO: 0.12 ± 0.01, n = 21; DKO + Vti1a: 0.24 ± 0.03, n = 20; DKO + Vti1b: 0.24 ± 0.03, n = 19; ANOVA). e Similar half decay time of the maximum HFS response between groups (DHZ: 21.45 ± 0.44, n = 17; DKO: 18.06 ± 2.25, n = 21; DKO + Vti1a: 21.24 ± 1.20, n = 20; DKO + Vti1b: 22.13 ± 2.23 s, n = 19; Kruskal–Wallis). f Representative traces of evoked (top) and spontaneous mini (bottom) excitatory postsynaptic currents (EPSC). g Reduced evoked EPSC charge transfer in DKO neurons (DHZ: 145.03 ± 42.66, n = 15; DKO: 18.36 ± 5.19 pC, n = 18; Mann–Whitney). h Reduced spontaneous mini EPSC (mEPSC) charge transfer in DKO neurons (DHZ: 0.19 ± 0.01, n = 17; DKO: 0.14 ± 0.01 pC, n = 15; t-test). i Reduced spontaneous mEPSC frequency in DKO neurons (DHZ: 15.45 ± 3.84, n = 18; DKO: 5.55 ± 1.79 Hz, n = 15; Mann–Whitney). j The readily releasable pool (RRP), calculated as total sucrose-induced (500 mM) charge transfer, is reduced in DKO (DHZ: 3.23 ± 1.28, n = 11; DKO: 0.49 ± 0.12 nC, n = 10; Mann–Whitney). Inset shows representative examples. k SV release probability, calculated as charge transfer during the first evoked over RRP, is reduced in DKO neurons (DHZ: 6.9 ± 0.9, n = 11; DKO: 3.9 ± 0. 7%, n = 10; t-test). Bars show mean ± SEM. Scatterplots and columns represent individual neurons and litters, respectively. *p < 0.05; **p < 0.01; ***p < 0.001

