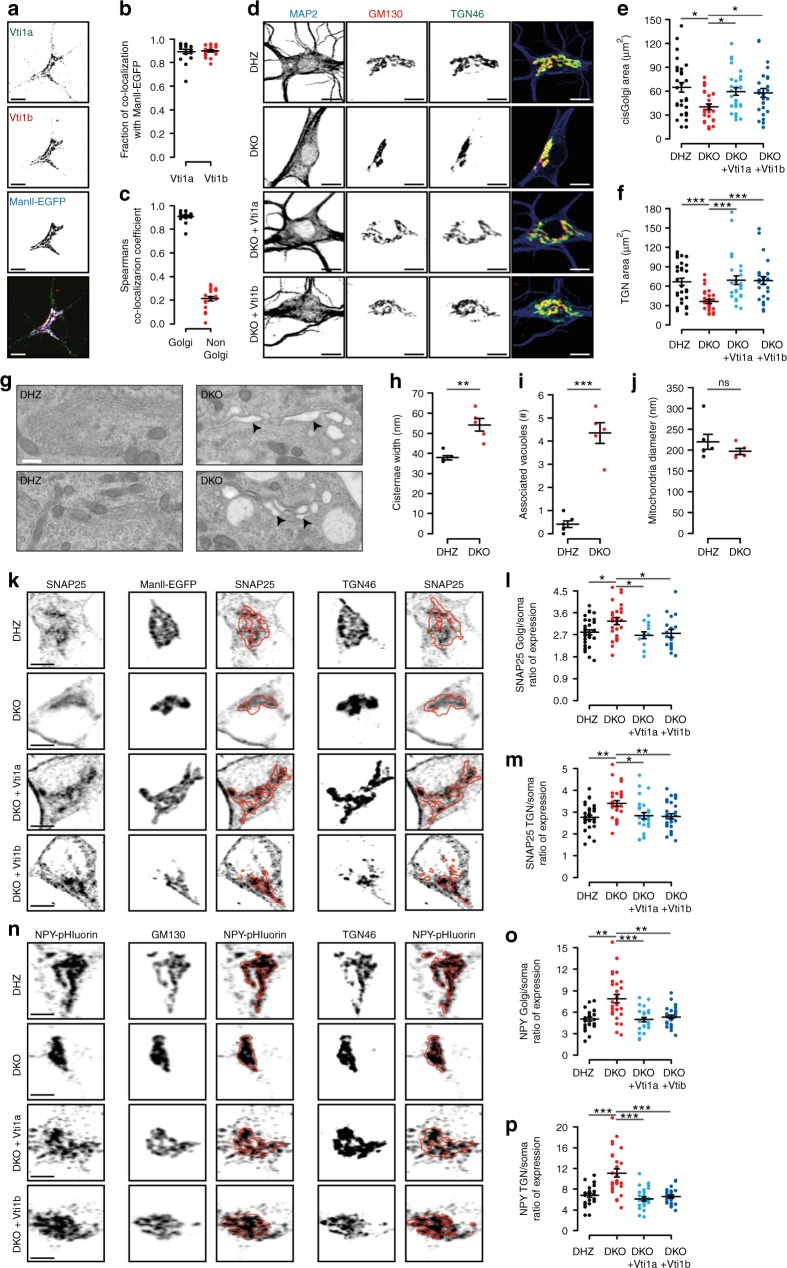
Fig. 6.
Golgi morphology abnormalities and protein accumulation in Vti1a/b-deficient neurons. a Examples of DIV-14 single DHZ neurons expressing ManII-EGFP and immunostained for Vti1a/b. b ManII-EGFP overlaps with Vti1a and Vti1b (89 ± 2 and 90 ± 1%, respectively; n = 19). c Spearman’s correlation coefficient for Vti1a and Vti1b inside and outside of the Golgi (93 ± 1 and 22 ± 2%, respectively; n = 19). d Examples of DIV-14 single neurons immunostained for MAP2, TGN46 and GM130. e Reduced GM130-positive area in DKO neurons (DHZ: 64.60 ± 6.05, n = 30; DKO: 40.42 ± 3.49, n = 29; DKO + Vti1a: 59.46 ± 4.74, n = 29; DKO + Vti1b: 57.91 ± 5.40 µm2, n = 27; Kruskal–Wallis). f Reduced TGN46-positive areas in DKO neurons (DHZ: 67.13 ± 5.46, n = 30; DKO: 36.45 ± 2.98, n = 29; DKO + Vti1a: 69.38 ± 6.66, n = 29; DKO + Vti1b: 68.73 ± 6.01µm2, n = 27; Kruskal–Wallis). g Representative electron micrographs of DIV-14 neurons. Arrowhead and asterisks point at examples of distended Golgi and clear-core vacuoles, respectively. h Increased Golgi cisternae width in DKO neurons (DHZ: 37.82 ± 1.00; DKO: 54.24 ± 3.24 nm; Mann–Whitney). i More vacuoles within 500 nm of Golgi stacks in DKO neurons (DHZ: 0.41 ± 0.14; DKO: 4.34 ± 0.45 vacuoles; t-test). j Similar mitochondria diameter between groups (DHZ: 219.87 ± 18.02; DKO: 196.59 ± 7.63 nm; Mann–Whitney). k Examples of DIV-5 single neurons expressing MannII-EGFP and immunostained for SNAP25 and TGN46. Red lines represent MannII-EGFP- or TGN46-positive areas. l Increased SNAP25 expression ratio at the Golgi in DKO neurons (DHZ: 2.80 ± 0.10, n = 31; DKO: 3.26 ± 0.14, n = 26; DKO + Vti1a: 2.68 ± 0.14, n = 14; DKO + Vti1b: 2.76 ± 0.16, n = 18; ANOVA). m Increased SNAP25 expression ratio at the TGN in DKO neurons (DHZ: 2.76 ± 0.10, n = 33; DKO: 3.40 ± 0.13, n = 29; DKO + Vti1a: 2.84 ± 0.15, n = 26; DKO + Vti1b: 2.80 ± 0.12, n = 26; ANOVA). n Examples of DIV-5 single neurons expressing NPY-pHluorin and immunostained for GM130 and TGN46. Red lines represent GM130- or TGN46-positive areas. o Increased NPY-pHluorin ratio of expression at the Golgi in DKO neurons (DHZ: 5.03 ± 0.28, n = 25; DKO: 7.88 ± 0.59, n = 28; DKO + Vti1a: 4.96 ± 0.30, n = 27; DKO + Vti1b: 5.33 ± 0.25, n = 28; Kruskal–Wallis). p Increased NPY-pHluorin expression ratio at the TGN in DKO neurons (DHZ: 6.82 ± 0.39, n = 25; DKO: 11.11 ± 0.79, n = 28; DKO + Vti1a: 6.13 ± 0.39, n = 27; DKO + Vti1b: 6.56 ± 0.29, n = 28; Kruskal–Wallis). Bars show mean ± SEM. Scatterplots and columns represent individual neurons and litters, respectively. *p < 0.05; **p < 0.01; ***p < 0.001. Scale bar = 10 µm (a, d), 500 nm (g), 5 µm (j, m). Expression ration represent reporter intensity in Golgi or TGN over rest of the soma

