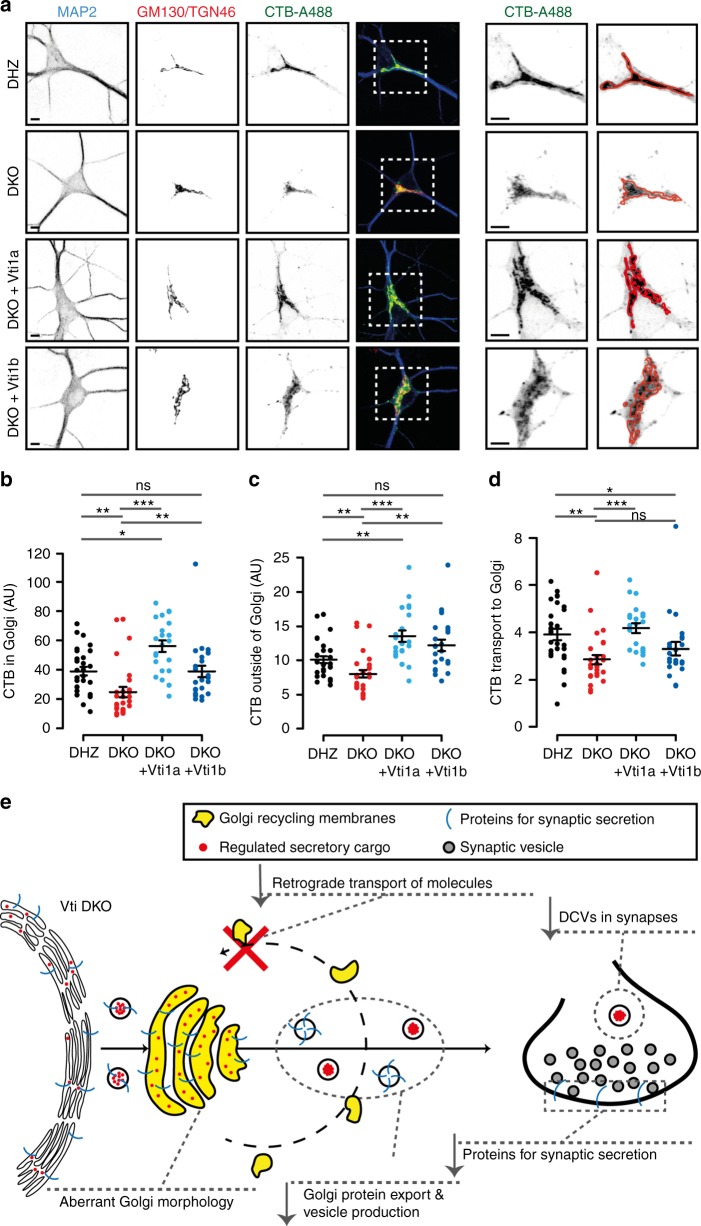
Fig. 8.
Defective retrograde transport in Vti1a/b-deficient neurons. a Representative examples and zooms of DIV-14 single neurons incubated with CTB-A488 and immunostained for MAP2, GM130, and TGN46. Red lines represent GM130/TGN46-positive areas. Scale bar = 5 µm. b CTB-A488 intensity at GM130/TGN46-positive areas (DHZ: 39.01 ± 2.88 n = 29; DKO: 24.73 ± 3.39, n = 29; DKO + Vti1a: 56.11 ± 3.90, n = 22; DKO + Vti1b: 38.901 ± 4.03 AU, n = 24; Kruskal–Wallis). c CTB-A488 intensity, excluding GM130/TGN46-positive areas (DHZ: 100.80 ± 5.01, n = 29; DKO: 80.05 ± 5.59, n = 29; DKO + Vti1a: 135.47 ± 8.32, n = 22; DKO + Vti1b: 122.03 ± 8.19 AU, n = 24; Kruskal–Wallis). d CTB-A488 transport to the Golgi, measured as intensity in the Golgi over rest of the neuron, is reduced in DKO neurons and only rescued by Vti1a (DHZ: 3.90 ± 0.23, n = 29; DKO: 2.85 ± 0.19, n = 29; DKO + Vti1a: 4.17 ± 0.21, n = 22; DKO + Vti1b: 3.28 ± 0.28, n = 24; Kruskal–Wallis). e Original working model. Impaired retrograde transport of membrane and sorting molecules to the Golgi in DKO neurons results in a decreased Golgi size, aberrant Golgi ultrastructure and reduced cargo export which, ultimately, compromises regulated secretion. Bars show mean ± SEM. Scatterplots and columns represent individual neurons and litters, respectively. *p < 0.05; **p < 0.01; ***p < 0.001

