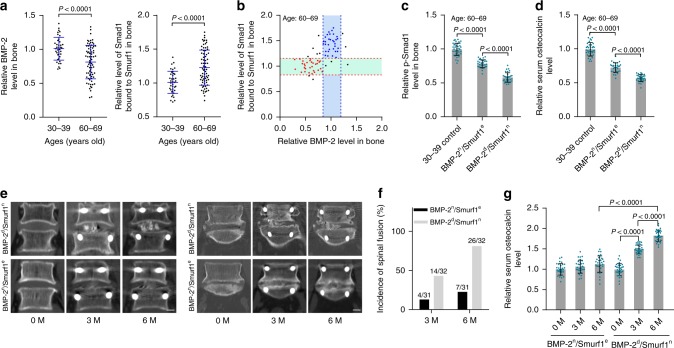
Fig. 2.
Local rhBMP-2 response in human BMP-2n/Smurf1e and BMP-2d/Smurf1n subgroups. a Relative levels of intraosseous BMP-2 (left) and Smurf1 activity (Smad1 bound to Smurf1, right) in osteoporotic LSS patients aged 60–69 years old (n = 74). b Classification of osteoporotic LSS patients into subgroups based on intraosseous BMP-2 levels and Smurf1 activity (Smad1 bound to Smurf1). The cluster of blue dots, BMP-2n/Smurf1e subgroup; the cluster of red dots, BMP-2d/Smurf1n subgroup. Relative levels of intraosseous BMP-2 (mean ± s.d., indicated by the two blue dashed lines) and Smad1 bound to Smurf1 (mean ± s.d., indicated by the two red dashed lines) in adult LDH patients (30–39 years old) served as cutoff parameters. c Relative level of intraosseous p-Smad1 in BMP-2n/Smurf1e subgroup (n = 31) and BMP-2d/Smurf1n subgroup (n = 32). d Relative level of serum osteocalcin in the above two subgroups. e CT scan showing representative images of spinal fusion in L4-L5 vertebrae (left) or L5-S1 vertebrae (right) in the above two subgroups after local administration of rhBMP-2. Scale bar = 1.0 cm. f Incidence of spinal fusion during rhBMP-2 treatment in the above two subgroups, followed by chi-squared test (P = 0.007 and P < 0.0001 for BMP-2d/Smurf1n versus BMP-2n/Smurf1e at 3 M and 6 M, respectively). g Relative serum osteocalcin level during rhBMP-2 treatment in the above two subgroups. Prior to rhBMP-2 treatment, the levels of BMP-2, p-Smad1, osteocalcin and Smad1 bound to Smurf1 were normalized to the mean values of adult LDH patients (30–39 years old) (n = 39). After the rhBMP-2 treatment for 3 months (3 M) or 6 months (6 M), the levels of osteocalcin in the above two subgroups were normalized to their respective baseline at 0 month (0 M). Data are mean ± s.d. followed by one-way ANOVA with a post-hoc test or Student’s t test

