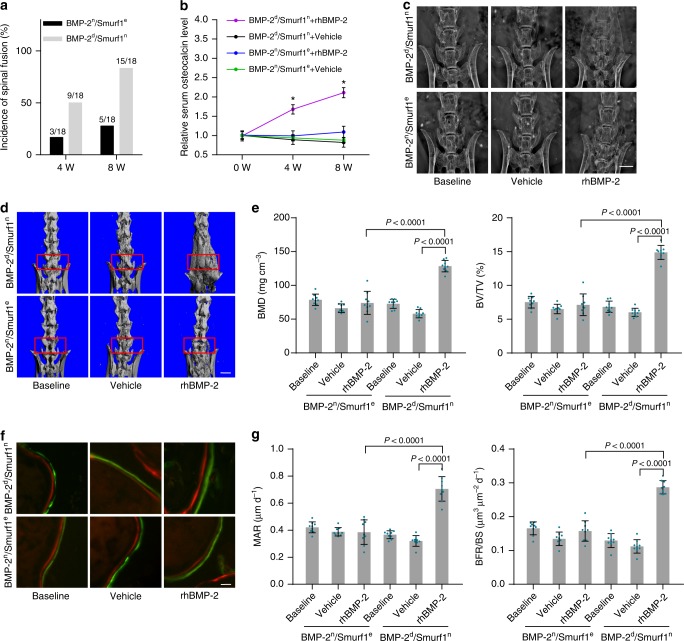
Fig. 3.
Local rhBMP-2 response in mouse BMP-2n/Smurf1e and BMP-2d/Smurf1n subgroups. a Manual assessment of spinal fusion incidence in BMP-2n/Smurf1e and BMP-2d/Smurf1n subgroups of 15-month-old osteoporotic mice (OVX at 6 months old) with local administration of rhBMP-2 (10 μg per piece of ACS bilaterally, n = 18 per group). Fisher’s exact test was performed (P = 0.002 for BMP-2d/Smurf1n versus BMP-2n/Smurf1e at 8 W). b Relative serum osteocalcin level in BMP-2n/Smurf1e and BMP-2d/Smurf1n subgroups during local administration of rhBMP-2 or vehicle (PBS). The level of serum osteocalcin in BMP-2n/Smurf1e and BMP-2d/Smurf1n subgroups at 4 weeks (4 W) and 8 weeks (8 W) were normalized to their respective vehicle baseline at 0 week (0 W). *P < 0.0001 for BMP-2d/Smurf1n + rhBMP-2 versus BMP-2n/Smurf1e + rhBMP-2 at 4 W and 8 W. c Radiographic analysis of spinal fusion in L4-L6 vertebrae by X-ray. Scale bars, 3.0 mm. d Representative images showing intertransverse fusion bridge in spinal fusion sites by microCT reconstruction. Scale bars, 2.5 mm. e microCT measurements for BMD and BV/TV in spinal fusion sites (indicated by red rectangle). f Representative images showing bone formation in spinal fusion sites assessed by xylenol (red) and calcein (green) labeling. Scale bars, 10 μm. g Analysis of dynamic bone histomorphometric parameters (MAR and BFR/BS) in spinal fusion sites. n = 9 per group. Data are mean ± s.d. followed by one-way ANOVA with a post-hoc test

