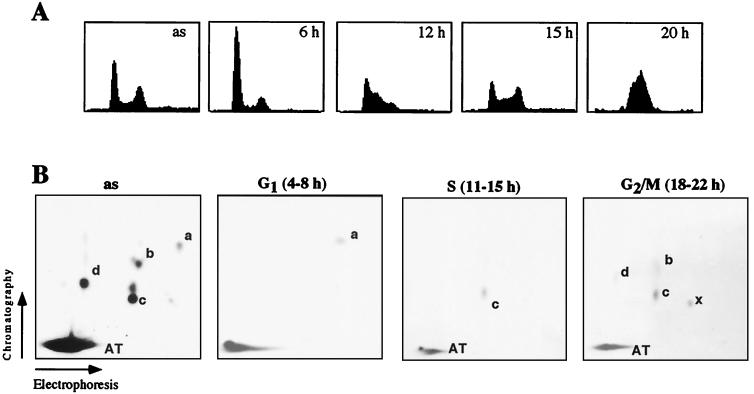
Figure 1.
Phosphorylation pattern of UBF during G1-, S-, and G2/M-phase. (A) Fluorescence-activated cell sorter (FACS) analysis. NIH 3T3 cells were synchronized by serum starvation followed by serum stimulation for 6, 12, 15, and 20 h. Asynchronous cells (as) are shown for comparison. (B) Tryptic phosphopeptide maps. 4 × 10⁵ asynchronous (as) or synchronized NIH 3T3 cells were metabolically labeled for 4 h in the presence of [32P]orthophosphate (2.5 mCi/ml). UBF was precipitated with α-UBF antibodies and analyzed by tryptic phosphopeptide mapping. The autoradiographs were exposed for 5 (as) and 9 days (G1, S, G2/M).

