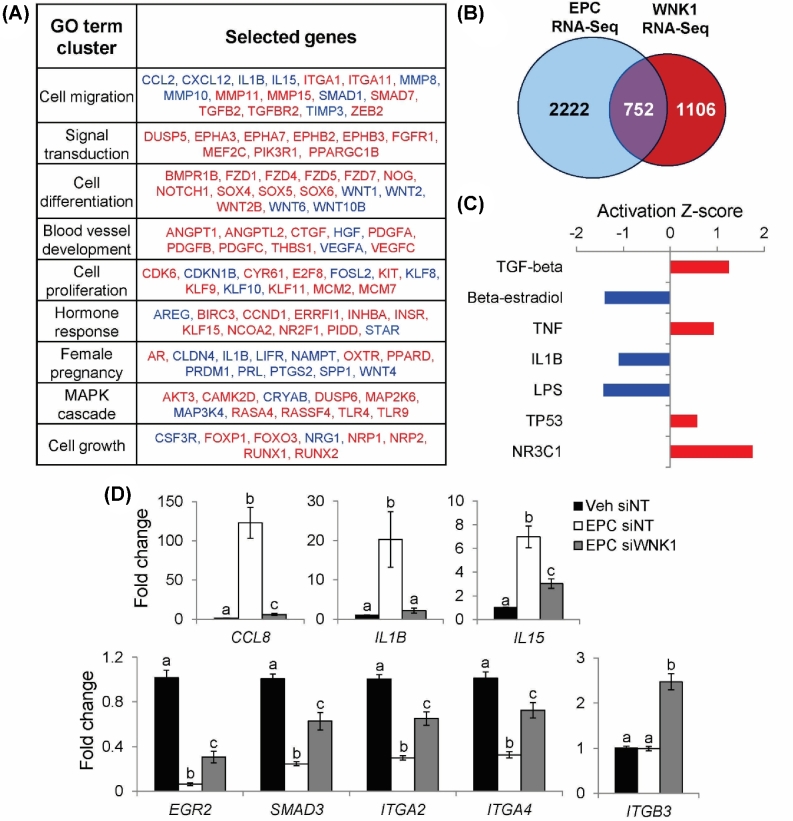
Figure 2.
Analysis of WNK1-regulated functions and signaling pathways by RNA-Seq. (A) Identification of enriched GO terms among 1858 WNK1-regulated genes using DAVID. Top GO term clusters (ranked by enrichment P-value) are shown along with WNK1 target genes belonging to each ontological cluster. Genes in red are upregulated by WNK1 knockdown; genes in blue are downregulated by WNK1 knockdown. (B) Overlap between EPC RNA-Seq (comparing Veh- and EPC-treated HESCs) and WNK1 RNA-Seq. (C) IPA of 752 genes regulated by WNK1 and decidualization to identify enrichments for upstream regulator pathways. Activation Z-score indicates that regulatory pathways are activated (positive Z-score, red) or inhibited (negative Z-Score, blue) by WNK1 knockdown. (D) Relative mRNA expression of CCL8, IL1B, IL15, EGR2, SMAD3, ITGA2, ITGA4, and ITGB3. Bars indicate mean values and SEM. Different letters denote means that are significantly different (P < 0.05, ANOVA with Tukey's MCA).

