
Figure 3. Structural Characterization of Protein Complexes from Cell Extract.
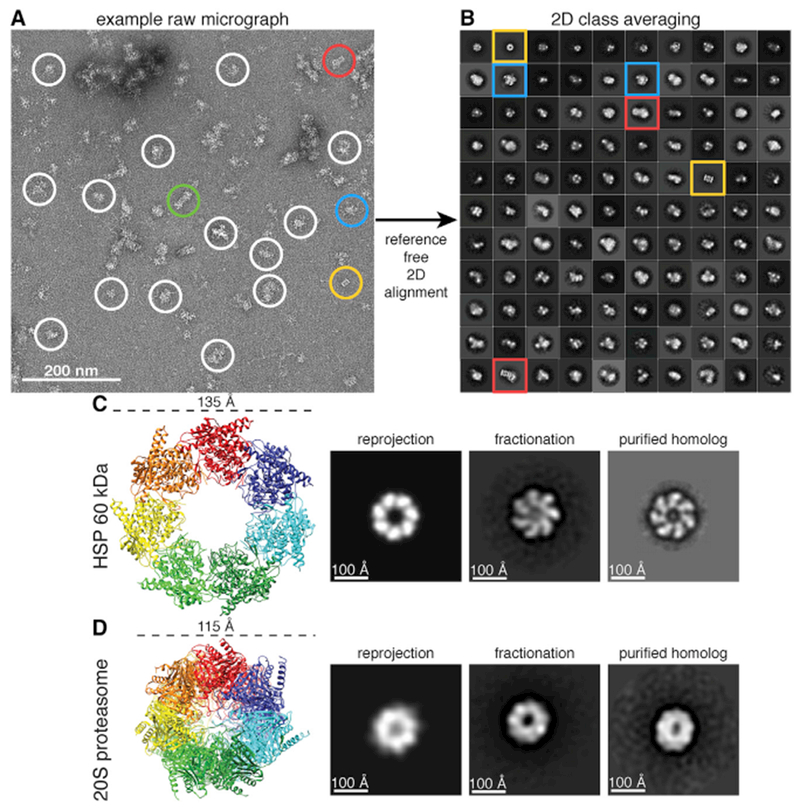
(A) Raw micrograph of negatively stained sample from SEC. Proteasome particles in three different biochemical forms, 20S core, single-capped 26S (20S core with one 19S regulatory particle), and double-capped 26S (20S core with two 19S regulatory particle), are circled in gold, red, and green, respectively. Representative unidentified particles are circled in white. Class averages with well-resolved structural features are circled in blue.
(B) Reference-free 2D class averages of 31,731 template-picked particles generated using RELION. The size of each box is 576 × 576 Å. The 2D class averages are sorted in decreasing order based on the number of particles belonging to a class, with 110 out of 300 2D classes shown.
(C) Crystal structure of HSP60 (PDB: 4PJ1) identified by MS and its corresponding reprojection after being low-pass filtered to 30 Å. The 2D class average from our fractionation (fraction 8) matching both the reprojection and a class average of a negatively stained purified homolog (GroEL), adapted from Danziger et al. (2003), suggests the identity of our 2D class average as HSP60. Image box sizes are scaled for consistency.
(D) Crystal structure of the 20S proteasome (PDB: 4R30) and its corresponding reprojection after being low-pass filtered to 30 Å. The 2D class average from our fractionation (fraction 4) matching both the reprojection and a class average of a negatively stained, purified S. cerevisiae proteasome suggests the identity of our 2D class average as the 20S proteasome. Image box sizes are scaled for consistency.
See also Figure S2.