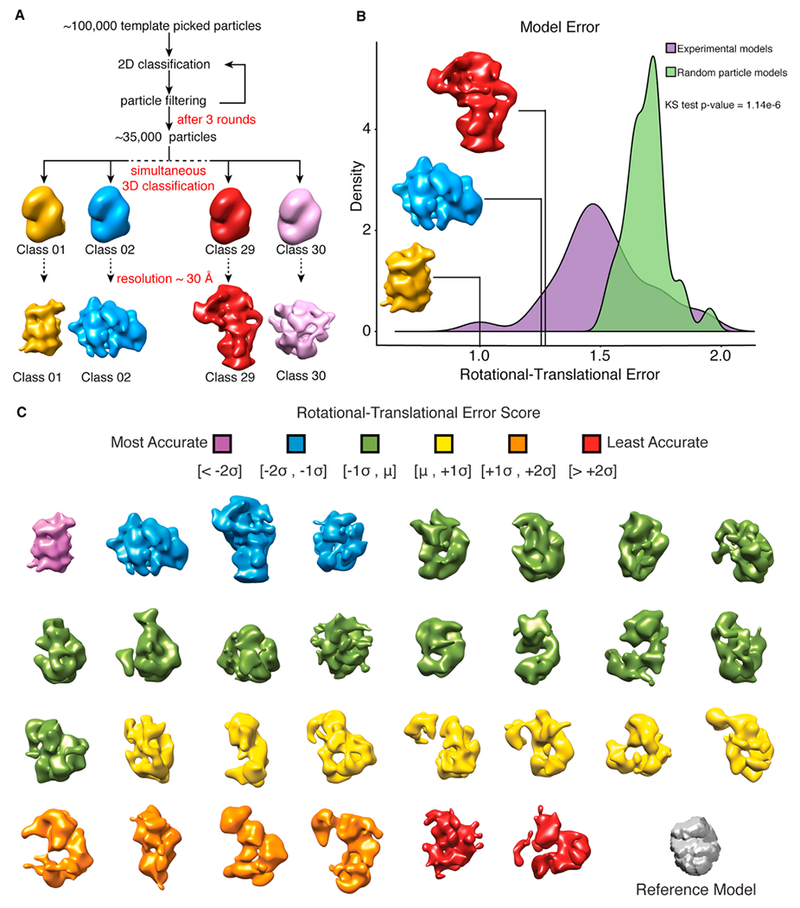
Figure 4. Classification of Distinct Protein Complex Architectures.

(A) Classification workflow for the simultaneous generation of 30 3D models from the complete dataset of particles using RELION. Models were built using DNA-dependent protein kinase catalytic subunit low-pass filtered to 60 Å as an arbitrary reference model.
(B) Top 3 models generated using RELION. Models were scored based on their rotational-translational error (a measure of the internal consistency of the model; see STAR Methods). The distribution of model error scores was compared to models generated using random particles from our template-picked data.
(C) 30 classes generated using RELION from the complete template-picked dataset of particles with the reference model shown in gray. Models are colored by their rotational-translational error and are unrelated to colors in (A) and (B).
See also Figure S3.
