Fig. 2.

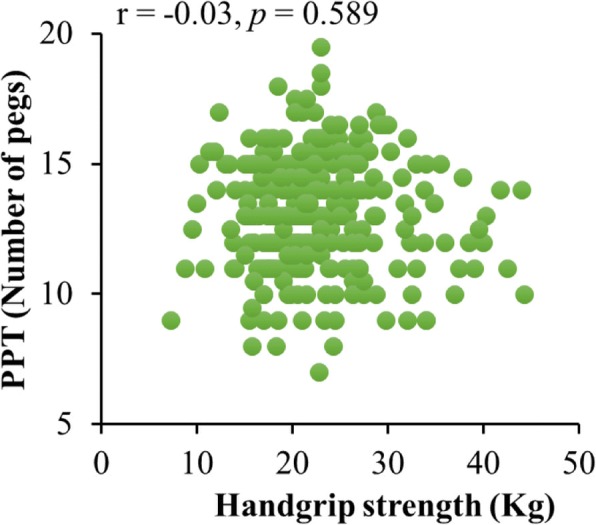
Scatter diagram of the relationship between handgrip strength and hand dexterity, measured by PPT performance. The plot shows the best-fit simple regression line, the correlation coefficient (r) and the statistical significance (p)

Scatter diagram of the relationship between handgrip strength and hand dexterity, measured by PPT performance. The plot shows the best-fit simple regression line, the correlation coefficient (r) and the statistical significance (p)