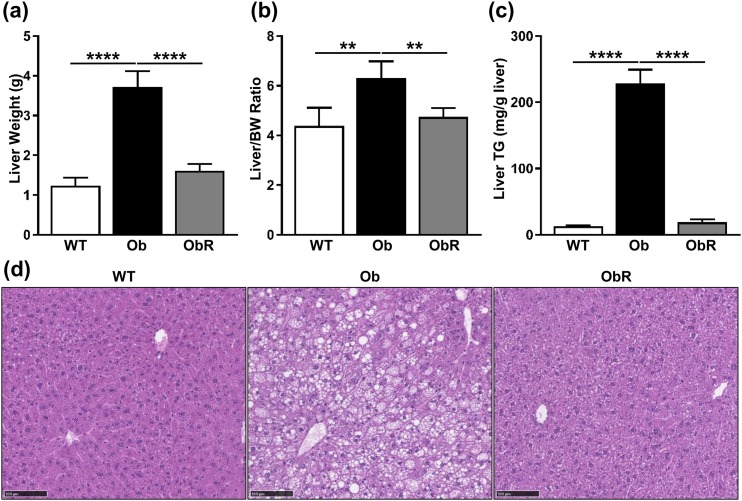
Figure 3.
Hepatomegaly and steatosis diminished in Ob/Ob rescue mice. Terminal measurements of (a) total liver mass, (b) liver/BW ratio, and (c) liver TGs. (d) Representative H&E staining performed on liver sections (20× objective; scale bar, 100 μm). Data represented as mean ± SD (n = 4 to 5). Significance determined by one-way ANOVA. **P < 0.01; ****P < 0.0001.

