Figure 8.
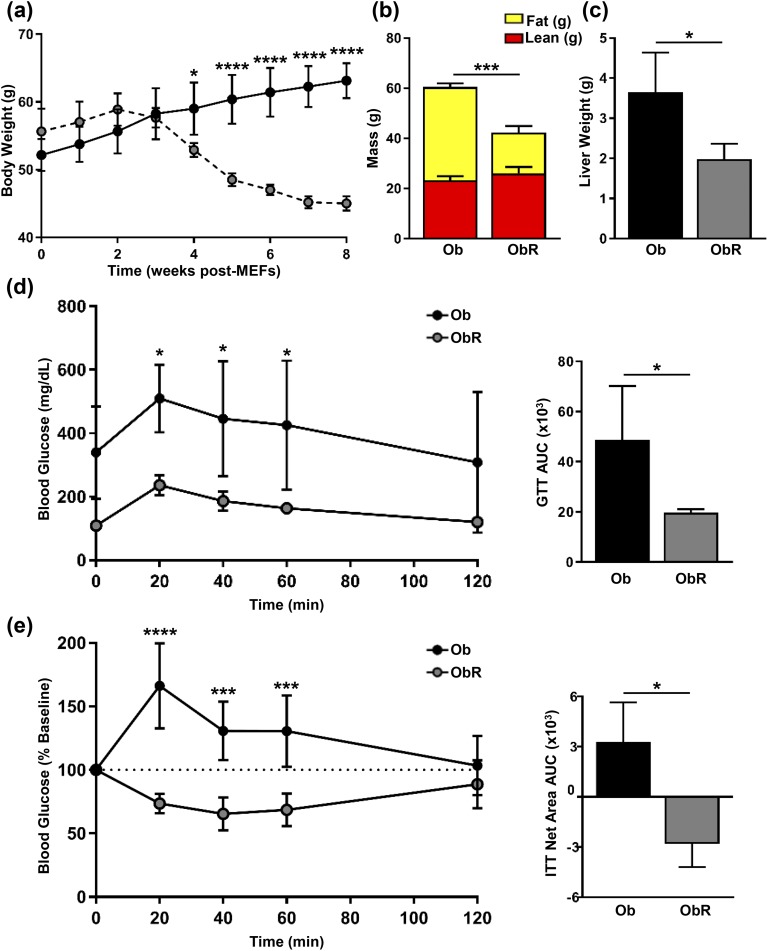
Obese ob/ob mice are rescued with MEF implantation. At 12 weeks of age ob/ob mice were treated with or without subcutaneous injection of WT MEFs. (a) BWs were determined weekly and represented as weeks after MEF implantation. (b) After 8 weeks post-MEFs, body composition determined by EchoMRI. (c) Liver weight measured at necropsy. (d) GTT performed after IP injection of glucose (1 mg/kg BW), with calculation of AUC (right). (e) ITT performed after IP injection of insulin (1 U/kg BW) and expressed as percentage change from baseline, with calculation of AUC net area from baseline (right). Data represented as mean ± SD (n = 4). Significance determined by either two-way (GTT and ITT) or one-way ANOVA. *P < 0.05; ***P < 0.001; ****P < 0.0001.

