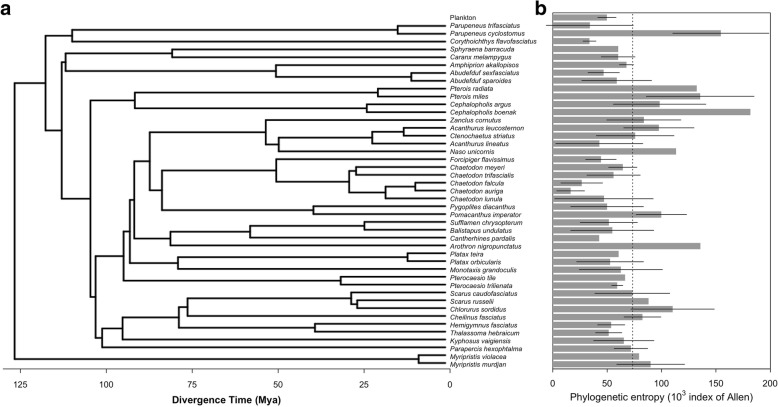
Fig. 1.
Phylogenetic tree and mean phylogenetic entropy of 44 fish species. a Phylogenetic tree relating all 44 fish species included in this study adapted from Rabosky et al. b Mean phylogenetic entropy of their skin-associated microbial community. Thick bars represent the mean of phylogenetic entropies across individuals belonging to the same fish species and horizontal segments represent the standard deviation across them. Dotted line indicates average phylogenetic entropy across all fish species. Phylogenetic entropy of planktonic communities is illustrated at the top of right panel

