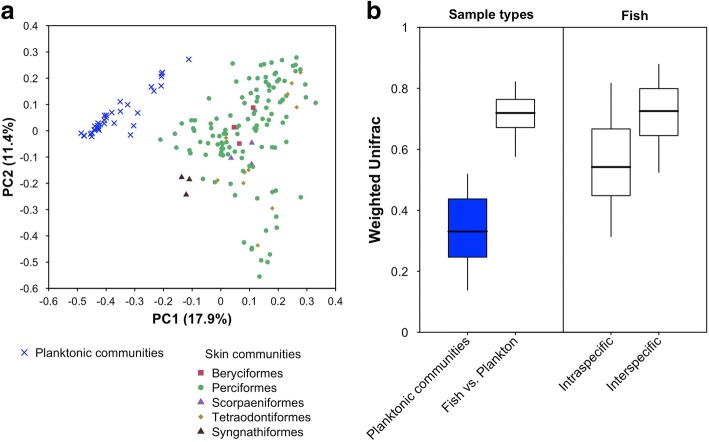
Fig. 3.
Dissimilarity between communities. a PCoA plot representing all fish skin microbiomes and planktonic communities included in this study, based on weighted phylogenetic dissimilarity values (W-Unifrac) between communities. Each dot represents one community (i.e., a water sample or a fish individual). Shape and color of dots indicate community type and fish taxonomic order. b W-Unifrac values, among planktonic communities (n = 35 samples), between fish skin microbiomes and planktonic communities (n = 173), between individuals of the same fish species (n = 34 species with more than 1 individual), and among individuals from different species (n = 44 species). Boxes represent the interquartile range dissimilarity values. Thick bars represent the median of dissimilarity values, and vertical segments extend to the fifth and the 95th percentiles of the distribution of values

