Fig. 3.
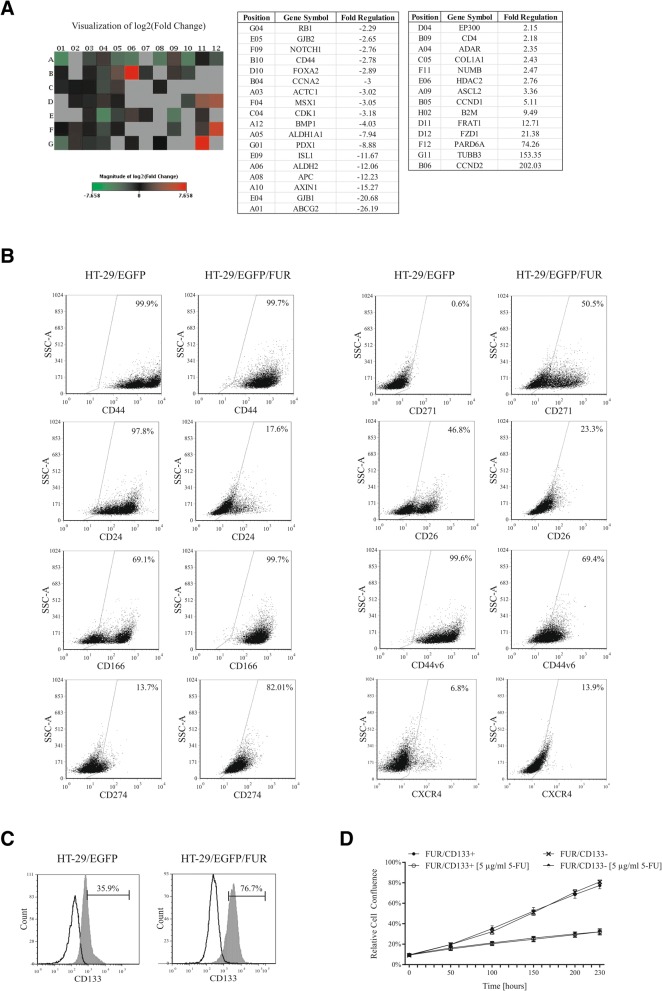
Multiple CSC markers are altered in HT-29/EGFP/FUR cells. a The Human Stem Cell RT2 Profiler PCR gene expression array revealed statistically significant down- and upregulation of several genes (shown in the table) in HT-29/EGFP/FUR compared to parental HT-29/EGFP cells. b The cells were stained with specific anti-human antibodies and analyzed by flow cytometry. The results demonstrated that the chemoresistant cell line was both enriched and depleted for cells expressing specific CSC markers when compared to parental cell line. Isotype control antibodies were used as staining controls. c The flow cytometric analysis showed increased expression of CD133 marker in chemoresistant cells over parental counterparts. Black line – isotype control, gray fill – CD133-positive cell population. d CD133+ and CD133− subpopulations of the chemoresistant cells (referred to as FUR/CD133+ and FUR/CD133−, respectively) were immunomagnetically separated from bulk HT-29/EGFP/FUR. The proliferation of subpopulations with addition of chemotherapeutic drugs (5-FU depicted as one example) was monitored by the kinetic imaging system. Data demonstrated the same proliferation rates. Values were expressed as means of quadruplicates ± SD

