
Fig. 4.
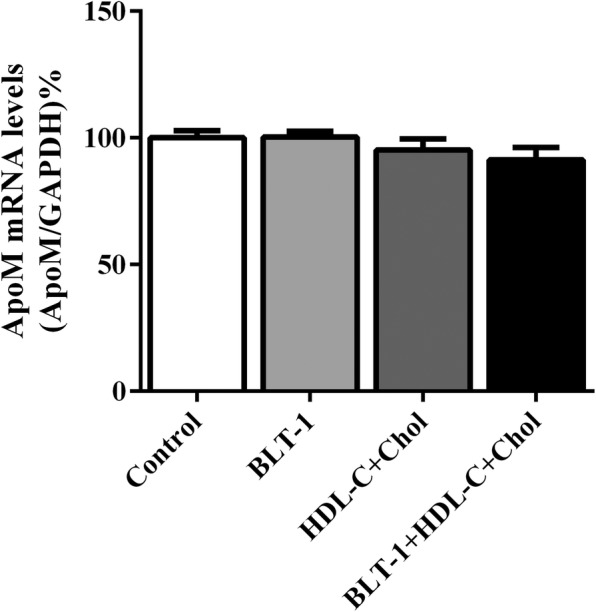
Effects of HDL-C, cholesterol, and BLT-1 on ApoM expression in HepG2 cells. ApoM mRNA levels in cells cultured with HDL-C, cholesterol and BLT-1 for 12 h were measured by RT-PCR. The control group without HDL-C, cholesterol or BLT-1 was set as 100%. n = 6 for each group, data are presented as the mean ± SD